
Enhanced Unsupervised Discriminant Dimensionality Reduction for Nonlinear Data
Proceedings of the Thirty-Fourth International Joint Conference on Artificial Intelligence. Main Track. Pages 6370-6378.
https://doi.org/10.24963/ijcai.2025/709
Keywords
- Machine Learning: ML: Clustering
Abstract
Linear Discriminant Analysis (LDA) is a classical supervised dimensionality reduction algorithm. However, LDA focuses more on global structure and overly depends on reliable data labels. For data with outliers and nonlinear structures, LDA cannot effectively capture the true structure of the data. Moreover, the subspace dimension learned by LDA must be smaller than cluster number, which limits its practical applications. To address these issues, we propose a novel unsupervised LDA method that combines centerless K-means and LDA. This method eliminates the need to calculate cluster centroids and improves model robustness. By fusing centerless K-means and LDA into a unified framework and deducing the connection between K-means and manifold learning, this method captures the local manifold structure and discriminative structure. Additionally, the dimensionality of the subspace is not restricted. This method not only overcomes the limitations of traditional LDA but also improves the model’s adaptability to complex data. Extensive experiments on seven datasets demonstrate the effectiveness of the proposed method.
- [Arthur and Vassilvitskii, 2007] David Arthur and Sergei Vassilvitskii. K-means++: the advantages of careful seed- ing. In Proceedings of the ACM-SIAM Symposium on Dis- crete Algorithms, page 1027-1035, 2007.
- [Belkin and Niyogi, 2003] Mikhail Belkin and Partha Niyogi. Laplacian eigenmaps for dimensionality re- duction and data representation. Neural computation, 15(6):1373-1396, 2003.
- [Cai et al., 2010] Deng Cai, Chiyuan Zhang, and Xiaofei He. Unsupervised feature selection for multi-cluster data. In Proceedings of the ACM SIGKDD International Confer- ence on Knowledge Discovery and Data Mining, page 333-342, 2010.
- [Celebi et al., 2013] M Emre Celebi, Hassan A Kingravi, and Patricio A Vela. A comparative study of efficient ini- tialization methods for the k-means clustering algorithm. Expert systems with applications, 40(1):200-210, 2013.
- [Chen et al., 2013] Dong Chen, Xudong Cao, Fang Wen, and Jian Sun. Blessing of dimensionality: High-dimensional feature and its efficient compression for face verification. In Proceedings of the IEEE Conference on Computer Vi- sion and Pattern Recognition, page 3025-3032, 2013.
- [Deng et al., 2019] Ping Deng, Hongjun Wang, Tianrui Li, Shi-Jinn Horng, and Xinwen Zhu. Linear discriminant analysis guided by unsupervised ensemble learning. In- formation Sciences, 480:211-221, 2019.
- [Ding and Li, 2007] Chris Ding and Tao Li. Adaptive dimen- sion reduction using discriminant analysis and k-means clustering. In Proceedings of the International Conference on Machine Learning, page 521-528, 2007.
- [Fanty and Cole, 1990] Mark Fanty and Ronald Cole. Spo- ken letter recognition. In Proceedings of the International Conference on Neural Information Processing Systems, page 220-226, 1990.
- [Fisher, 1936] Ronald A Fisher. The use of multiple mea- surements in taxonomic problems. Annals of eugenics, 7(2):179-188, 1936.
- [Gao et al., 2023] Quanxue Gao, Qianqian Wang, Han Lu, Wei Xia, and Xinbo Gao. Rethinking k-means from manifold learning perspective. arXiv preprint arXiv:2305.07213, 2023.
- [Georghiades et al., 1997] A. Georghiades, P. Belhumeur, and D. Kriegman. Yale face database. http://cvc.yale.edu/ projects/yale-face-database, 1997. Link
- [Hartigan and Wong, 1979] John A Hartigan and Manchek A Wong. Algorithm as 136: A k-means clustering algorithm. Journal of the royal statistical society, 28(1):100-108, 1979.
- [He and Niyogi, 2003] Xiaofei He and Partha Niyogi. Lo- cality preserving projections. In Proceedings of the In- ternational Conference on Neural Information Processing Systems, page 153-160, 2003.
- [He et al., 2005] Xiaofei He, Deng Cai, Shuicheng Yan, and Hong-Jiang Zhang. Neighborhood preserving embedding. In IEEE International Conference on Computer Vision, volume 2, pages 1208-1213. IEEE, 2005.
- [Heck et al., 2016] Michael Heck, Sakriani Sakti, and Satoshi Nakamura. Unsupervised linear discriminant anal- ysis for supporting dpgmm clustering in the zero resource scenario. Procedia Computer Science, 81:73-79, 2016.
- [Hou et al., 2013] Chenping Hou, Feiping Nie, Xuelong Li, Dongyun Yi, and Yi Wu. Joint embedding learning and sparse regression: A framework for unsupervised feature selection. IEEE transactions on cybernetics, 44(6):793- 804, 2013.
- [Kambhatla and Leen, 1997] Nandakishore Kambhatla and Todd K Leen. Dimension reduction by local principal component analysis. Neural computation, 9(7):1493- 1516, 1997.
- [Lin et al., 2019] Weibo Lin, Zhu He, and Mingyu Xiao. Balanced clustering: a uniform model and fast algorithm. In Proceedings of the International Joint Conference on Artificial Intelligence, page 2987-2993, 2019. IJCAI
- [Lu et al., 2023] Han Lu, Quanxue Gao, Qianqian Wang, Ming Yang, and Wei Xia. Centerless multi-view k-means based on the adjacency matrix. In Proceedings of the AAAI Conference on Artificial Intelligence, pages 8949-8956, 2023.
- [Lu et al., 2024] Han Lu, Huafu Xu, Qianqian Wang, Quanxue Gao, Ming Yang, and Xinbo Gao. Efficient multi-view -means for image clustering. IEEE Transac- tions on Image Processing, 33:273-284, 2024.
- [Lyons et al., 1999] Michael J Lyons, Julien Budynek, and Shigeru Akamatsu. Automatic classification of single fa- cial images. IEEE transactions on pattern analysis and machine intelligence, 21(12):1357-1362, 1999.
- [Ma and Zhu, 2013] Yanyuan Ma and Liping Zhu. A review on dimension reduction. International Statistical Review, 81(1):134-150, 2013.
- [Nanga et al., 2021] Salifu Nanga, Ahmed Tijani Bawah, Benjamin Ansah Acquaye, Mac-Issaka Billa, Francis De- lali Baeta, Nii Afotey Odai, Samuel Kwaku Obeng, and Ampem Darko Nsiah. Review of dimension reduction methods. Journal of Data Analysis and Information Pro- cessing, 9(3):189-231, 2021.
- [Nie et al., 2022] Feiping Nie, Jingjing Xue, Danyang Wu, Rong Wang, Hui Li, and Xuelong Li. Coordinate descent method for kk-means. IEEE Transactions on Pattern Anal- ysis and Machine Intelligence, 44(5):2371-2385, 2022.
- [Niijima and Okuno, 2008] Satoshi Niijima and Yasushi Okuno. Laplacian linear discriminant analysis approach to unsupervised feature selection. IEEE/ACM transactions on computational biology and bioinformatics, 6(4):605- 614, 2008.
- [Pei et al., 2023] Shenfei Pei, Huimin Chen, Feiping Nie, Rong Wang, and Xuelong Li. Centerless clustering. IEEE Transactions on Pattern Analysis and Machine Intelli- gence, 45(1):167-181, 2023.
- [Roweis and Saul, 2000] Sam T Roweis and Lawrence K Saul. Nonlinear dimensionality reduction by locally lin- ear embedding. science, 290(5500):2323-2326, 2000.
- [Tang et al., 2006] Hong Tang, Tao Fang, and Peng-Fei Shi. Laplacian linear discriminant analysis. Pattern Recogni- tion, 39(1):136-139, 2006.
- [Team, 2009] Casia Face Image Databases Service Team. Cas institute of automation. http://biometrics.idealtest. org/, 2009. Link
- [Turk and Pentland, 1991] Matthew Turk and Alex Pentland. Eigenfaces for recognition. Journal of cognitive neuro- science, 3(1):71-86, 1991.
- [Wang et al., 2007] Huan Wang, Shuicheng Yan, Dong Xu, Xiaoou Tang, and Thomas Huang. Trace ratio vs. ratio trace for dimensionality reduction. In IEEE Conference on Computer Vision and Pattern Recognition, pages 1-8, 2007.
- [Wang et al., 2014] De Wang, Feiping Nie, and Heng Huang. Unsupervised feature selection via unified trace ratio for- mulation and k-means clustering (track). In European Conference on Machine Learning and Principles and Practice of Knowledge Discovery in Databases, pages 306-321, 2014.
- [Wang et al., 2015] Xiaoqian Wang, Yun Liu, Feiping Nie, and Heng Huang. Discriminative unsupervised dimension- ality reduction. In Proceedings of the International Joint Conferences on Artificial Intelligence, page 3925-3931, 2015. IJCAI
- [Wang et al., 2020] Qianqian Wang, QuanXue Gao, Gan Sun, and Chris Ding. Double robust principal component analysis. Neurocomputing, 391:119-128, 2020.
- [Wang et al., 2023] Quan Wang, Fei Wang, Fuji Ren, Zhongheng Li, and Feiping Nie. An effective clustering optimization method for unsupervised linear discriminant analysis. IEEE Transactions on Knowledge and Data En- gineering, 35(4):3444-3457, 2023.
- [Winn and Jojic, 2005] John Winn and Nebojsa Jojic. Lo- cus: Learning object classes with unsupervised segmenta- tion. In IEEE International Conference on Computer Vi- sion, pages 756-763, 2005.
- [Wold et al., 1987] Svante Wold, Kim Esbensen, and Paul Geladi. Principal component analysis. Chemometrics and intelligent laboratory systems, 2(1-3):37-52, 1987.
- [Wu et al., 2020] Tong Wu, Yanni Xiao, Muhan Guo, and Feiping Nie. A general framework for dimensionality re- duction of k-means clustering. Journal of Classification, 37(3):616-631, 2020.
- [Xu et al., 2016] Jinglin Xu, Junwei Han, and Feiping Nie. Discriminatively embedded k-means for multi-view clus- tering. In IEEE Conference on Computer Vision and Pat- tern Recognition, pages 5356-5364, 2016.
- [Zhang et al., 2020] Zizhao Zhang, Han Zhang, Sercan O Arik, Honglak Lee, and Tomas Pfister. Distilling effec- tive supervision from severe label noise. In Proceedings of the IEEE/CVF Conference on Computer Vision and Pat- tern Recognition, pages 9294-9303, 2020.
References were extracted automatically from the PDF and may contain errors.
Full text extracted automatically from the PDF; figures, tables and equations may differ. The PDF is the version of record.
1 Introduction
Nowadays, high-dimensional data has become ubiquitous due to the development of data collection, posing significant challenges in data processing and analysis. High-dimensional data increases the computational complexity of data processing and may result in the curse of dimensionality and overfitting problem [Chen et al., 2013]. Therefore, dimensionality reduction attracts increasing attention for handling high-dimensional data, and numerous dimension reduction methods [Wang et al., 2020; Kambhatla and Leen, 1997; Ma and Zhu, 2013] are developed, including both unsupervised methods and supervised methods.
The most popular unsupervised dimensionality reduction methods are principal component analysis (PCA) [Wold et al., 1987], locality preservation projection (LPP) [He and Niyogi, 2003], and Neighborhood Preserving Embedding (NPE) [He et al., 2005]. PCA leverages linear transformation to map high-dimensional data into a low-dimensional subspace by maximizing the sample variance, which fully preserves the information of the original data and simultaneously reduces the dimension. However, PCA mainly focuses on maximizing the overall variance of the projected data [Nanga et al., 2021] but ignores the local information between samples, which results in performance degradation in some cases. Compared with PCA, LPP/NPE can retain local features in the original data by considering the relationship between adjacent samples. Besides, as their non-linear version, Laplacian Eigenmaps (LE) [Belkin and Niyogi, 2003] and Locally Linear Embedding (LLE) [Roweis and Saul, 2000] can better capture nonlinear structures in the data. However, without the instruction of labels, these methods generally cannot well exploit the discriminant information of the original data.
∗Corresponding Author
Linear discriminant analysis (LDA) [Fisher, 1936] is a classical supervised dimension reduction method, which seeks a projection matrix by enforcing the projective interclass distance to be larger and the intra-class distance to be smaller. LDA helps to extract the discriminant features of samples during dimension reduction, which is beneficial for improving classification performance. Besides, since LDA focuses on differences between clusters and concentrates less on local variations and noises, it performs better when data is corrupted with noise or outliers. However, LDA requires reliable data labels for dimension reduction, while large-scale data annotation can be costly and challenging [Zhang et al., 2020; Heck et al., 2016], which limits the practical application of LDA.
To mitigate this issue and meanwhile maintain the advantages of LDA, several unsupervised LDA methods are proposed [Wang et al., 2014; Deng et al., 2019]. Niijima et al. [2008] extended Laplacian LDA (LLDA) [Tang et al., 2006] to unsupervised cases and developed an LLDA-based recursive feature elimination (LLDA-RFE), which is able to handle high-dimensional data efficiently. LDA-UEL leverages unsupervised ensemble learning to guide LDA for unsupervised dimension reduction [Deng et al., 2019]. Ding et al. [2007] developed LDA-Km by combining the LDA and K-means into a coherent framework. LDA-Km leverages Kmeans to generate cluster labels to guide the LDA to adaptively select the subspace with the most discriminative features. Similarly, Wang et al. [2023] developed an unsupervised LDA (Un-LDA) method by jointly performing clustering and subspace learning. Wu et al. developed a general framework for dimensionality reduction of k-means clustering [Wu et al., 2020]. However, it relies on K-means to guide LDA for feature selection, while K-means suffers from sensitivity to the cluster centroid initialization, which significantly affects the clustering results and makes it less robust to outliers.
To address these problems, we propose a novel unsupervised LDA method for dimension reduction using centerless K-means. In this method, we unify centerless K-means and LDA in a general framework, which guides LDA in selecting subspaces most appropriate for clustering with cluster labels generated by centerless K-means. The adopted centerless Kmeans compute the clustering labels with the pairwise distance of samples rather than the distance between samples and centroids. Thus, it eliminates the requirement of computing centroids and improves the robustness of clustering. Besides, we use the learned label matrix to construct similarity matrix and the within-cluster scatter matrix for LDA, which simultaneously maintains the neighboring relationship and cluster structure relationship of LDA. Moreover, the dimension of the learned subspace is not limited to cluster number. The main contributions of the work can be summarized as follows:
- We propose a novel unsupervised linear discriminant analysis method by fusing centerless K-means and LDA into a unified framework, which simultaneously exploit discriminative structure and local neighbor structure.
- We employ centerless K-means to guide LDA, which avoids the calculation to cluster centroid and improves model robustness. Additionally, we introduce Butterworth filter distance to build distance matrix, which is able to handle nonlinear data.
- We conducted extensive experiments and comparisons on seven benchmark datasets, whose results clearly demonstrate the superiority of our method.
2 RelatedWork
2.1 Linear Discriminant Analysis
Given a set of input data xi(i = 1, 2, ..., n) ∈ Rd×1 and the projection matrix W ∈ Rd×t , LDA aims to separate the n samples of different classes in the new feature space yi = W⊤xi as much as possible, and the samples of the same class are as close as possible, to obtain samples with greater discriminability. For multiple classification problems, normalize all samples so that their mean is 0 and suppose that there are m classes, mk is the number of samples of the k-th class and uk represents the mean of class k, the optimization objective of LDA is
where the between-class scatter matrix
the within-class scatter matrix
and there is the total scatter matrix
Bringing Sb = St-Sw into Eq. (1), then it can be rewritten as follows:
2.2 K-means Clustering
As we all know, K-means clustering is to find the points closest to the centroid of the cluster and then group them together until each sample is closest to the corresponding centroid of the cluster, let A1,A2, · · · ,Am denotes mdifferent clusters, its optimization problem is as follows:
With simple algebra, we have:
Thus, we can see Eq. (6) is equal to tr(Sw),
2.3 Unsupervised LDA
Both K-means clustering and LDA rely on minimizing the intra-class distance between samples and centroids. Given a linear projection y =W⊤x, the within-class scatter distance in the subspace can be expressed as:
where Sw represents the within-class scatter matrix, xi is the i-th sample, uk is the mean of the k-th cluster, andW is the projection matrix.This is equivalent to performing K-means clustering in the subspace. This connection between LDA and K-means allows for the implementation of unsupervised LDA. Ding et al. [2007] and Wang et al. [2023] leveraged this relationship, integrating K-means clustering with LDA to propose the following optimization model:
This unsupervised LDA model employs K-means and is sensitive to cluster centroid initialization. Different initializations of cluster centroids yield distinct clustering outcomes, and the cluster centroids are susceptible to the influence of noisy data points, which can compromise the accuracy and robustness of the resulting clustering. Therefore, selecting appropriate cluster centroids is essential for achieving superior clustering performance. Furthermore, suboptimal initialization can result in the algorithm converging to local optima or negatively impacting its convergence rate [Arthur and Vassilvitskii, 2007; Celebi et al., 2013]. Another significant limitation is that it is still a global subspace learning method and does not consider the local manifold structure, which is important for clustering. To address these challenges, our method combines centerless K-means with LDA to eliminate the need to calculate the cluster centroid and mitigating the impact of noise on the clustering performance. Besides, we employ the pseudo labels to construct similarity matrix, which retains the discriminative structure and simultaneously exploit the local manifold structure.
3 ProposedMethodology
3.1 Motivations and Objectives
We first introduce the following Theorem 1 to implement the centerless K-means, which is the basis of our method.
Theorem 1. Given a set of input data X = {x1, x2, . . . , xn} ∈ Rd×n , assuming there are m clusters, where uk represents the mean of k-th cluster, Ak represents the optimized k-th cluster, and S is the similarity matrix, there is
where
Proof: Let uk = 1 mk ∑ xi∈Ak xi, mk represents the number of samples in the k-th clusters, Eq. (6) is expanded as follows:
Similarly, the right side of Eq. (10) is expanded as follows:
With Eq. (12) and Eq. (13), Theorem 1 is proved. From Theorem 1, we can conclude that, for the objective function of K-means, we can use the pairwise distance between neighbor samples to replace the distance between samples and the cluster centroid for optimization, under the condition where the similarity matrix S constructed from cluster labels. Specifically, suppose the matrix F ∈ Ind is a discrete and sparse cluster indicator matrix where each row fi represents the cluster label of i-th sample. If i-th(i = 1, 2, . . . , n) samples belong to k-th(k = 1, 2, . . . ,m) cluster, then Fik = 1, otherwise, Fik = 0. Because a sample belongs to only one cluster, so each row has only one element that is 1, and the rest of the elements are 0. Then, we can calculate Sij by Sij = ⟨fi, fj⟩. By introducing a discrete label matrix F, the K-means in Eq. (6) is equivalent to:
By replacing K-means objective with Eq. (14), it can avoid the sensitivity to centroid initialization and improve the robustness of clustering. We can then rewrite the within-cluster scatter distance in Eq. (8) as follows:
By substituting Eq. (15) into Eq. (5), we obtain our unsupervised LDA model that integrates centerless K-means clustering and LDA dimensionality reduction into a unified framework.
This framework enables simultaneous clustering and dimensionality reduction without requiring the input of true labels. In other words, we can obtain both the cluster indicator matrix F and the projection matrix W at the same time. By simplifying Eq. (16) and substituting Sij = ⟨fi, fj⟩ into it, we can obtain our final objective function:
Since there are two variables W and F in Eq. (17) that need to be solved, we utilize the optimization techniques described in [Wang et al., 2015; Xu et al., 2016] to implement an alternating optimization strategy. This approach allows us to iteratively update each variable. The specific steps for optimizing each variable are in the following subsection.
3.2 Optimization
(1) Fix F to solve W.
When F is fixed, the similarity matrix Sij is also fixed, solving Eq. (17) is equivalent to solving
Define Laplacian matrix of S as L = DS - S, where DS is the degree matrix of S, which is a diagonal matrix and its diagonal element is defined by (DS)ii = ∑j Sij. Thus, Eq. (18) can be written as
where Sl = XLX⊤. From Eq. (19), we can see that its denominator is the objective of LPP, which makes our method capable of exploiting local manifold structure.
According to [Fisher, 1936], Eq. (19) can be solved by the Lagrange multiplier method StW = λSlW, which performs eigenvalue decomposition on Sl-1St to obtain the target projection matrix W. However, obtaining an exact solution through eigenvalue decomposition directly using the trace ratio form is challenging, and the results may not converge. To address this issue, we transform the trace ratio problem into a trace difference problem [Wang et al., 2007]. By introducing a hyperparameter λ, the trace ratio problem described in Eq. (19) can then be reformulated into the following trace difference form for effective resolution:
According to Eq. (20), we only need to perform eigenvalue decomposition on St - λSl. Then, we order the eigenvalues
Algorithm 1 The whole process of solving problem (17)
Input: A set of input data X; hyperparameter λ
Initialization: W: setting an identity matrix to the first t rows; F: setting an identity matrix to every m rows
Output: Projection matrixW ∈ Rd×t , cluster indication matrix F ∈ Rn×m
- 1: while not converge do
- 2: Update F by solving Eq. (25);
- 3: UpdateWby solving Eq. (20);
- 4: end while
- 5: return Projection matrixW, cluster indicator matrix F
and take the t eigenvectors corresponding to the first t largest eigenvalues to compose the matrixW.
(2) Fix W to solve F.
Since the matrix W is fixed, tr(W⊤XX⊤W) is a constant, Eq.(12) become
where distance matrix D is expressed in terms of square Euclidean distance Dij = ||yi -yj||22 = ||W⊤(xi -xj)||22 . In addition to square Euclidean distance, we also introduce the Butterworth filter distance from [Lu et al., 2024] to obtain the distance matrix D, i.e.,
where Ω is a hyperparameter, and G is the similarity matrix, whose computation method is referred to [Lu et al., 2024]. By using the Butterworth filter distance to reduce the influence of outliers and deal with nonlinear data more effectively, the clustering effect of our method can be effectively improved. In the experimental part of Section 4, we can see that the clustering effect of Butterworth filter distance is better than that of Euclidean distance.
Because each row of the matrix F is independent and each row has only two discrete values of 0 and 1, in which only one element is 1 and the rest is 0, it is difficult to directly obtain its optimal solution. [Lu et al., 2023; Gao et al., 2023; Pei et al., 2023] proposed a good solution, first fixed the other rows, and then solved line by line to find the position of element 1 to get the whole cluster indicator matrix F. The concretesolving process is as follows:
When solving i-th row fi of the cluster indicator matrix F, the problem (21) can be rewritten as
Substituting Dii = 0 into Eq. (23), it becomes
where d⊤i = (Di1 Di2 · · · Din) ,Dii = 0, so the optimal solution to problem (21) can be expressed as
The whole algorithm flow of solving the problem (17) is shown in Algorithm 1.
3.3 Computational Complexity Analysis
Our algorithm flow is mainly divided into two parts: one is to solve the calculation matrix F according to Eq. (25), and the other is to solve the matrix W according to the eigenvalue decomposition of Eq. (20). The computational complexity of the former is O(n2m), while the latter, St - λSw is a symmetric matrix, so the symmetric QR algorithm is used for the real symmetric matrix, so its time complexity is O(d3 ). If T is the number of iterations, then the total complexity of our algorithm is O(T(d3 + n2m)). Although the complexity of each iteration is O(d3 ), our algorithm can converge after no more than 5 iterations, that is, T ≤ 5. Moreover, our method can obtain a better clustering result.
4 Experiments
To validate the effectiveness of our proposed model, we have extensively tested it on a Toy dataset and a diverse set of seven benchmark datasets. Moreover, we selected ten comparison methods. Our experiments were conducted on a Windows 11 desktop computer with a 13th Gen Intel(R) Core(TM) CPU, and MATLAB R2023a.
4.1 Experiment on Noises Dataset
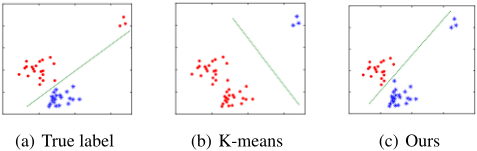
To evaluate the noise resistance and robustness of our proposed method, we designed a two-dimensional noises dataset comprising 2 clusters and 43 samples. As shown in Figure 1.(a), there are 20 samples in the Cluster 1 and 23 samples in the Cluster 2, the three samples far from the centroid of the Cluster 2 are noises. The Figure 1.(b) is the clustering labels of the K-means method on the noises dataset, and the Figure 1.(c) is the labels of our method on the noises dataset. K-means is to minimize the distance between samples and their nearest cluster centroids. However, due to the influence of cluster centroid calculations, K-means tends to merge two clusters that are originally close to each other, while grouping distant noise samples into a single cluster. In contrast, our method calculates the distances between sample pairs, thereby avoiding the computation of cluster centroids. This approach enhances the clustering performance in the presence of noise and demonstrates superior robustness.
4.2 Experimental Settings
Datasets: We selected seven benchmark datasets to verify the performance of our proposed method, which are FaceV5 [Team, 2009], Isolet [Fanty and Cole, 1990], JAFFE [Lyons et al., 1999], MSRC V2 [Winn and Jojic, 2005], ORL [Cai et al., 2010], UMIST [Hou et al., 2013] and Yaleface [Georghiades et al., 1997]. The details of these benchmark datasets are shown in Table 1.
| Dataset | Samples | Features | Classes | Types |
|---|---|---|---|---|
| FaceV5 | 2500 | 256 | 500 | Image |
| Isolet | 1560 | 617 | 26 | Voice |
| JAFFE | 213 | 676 | 10 | Image |
| MSRC V2 | 210 | 576 | 7 | Image |
| ORL | 400 | 1024 | 40 | Image |
| UMIST | 575 | 1024 | 20 | Image |
| Yaleface | 165 | 1024 | 15 | Image |
Metrics: To evaluate the performance of our algorithm, We employed three widely accepted clustering evaluation metrics: Accuracy (ACC), Normalized Mutual Information (NMI), and Purity. Higher values of these metrics indicate superior clustering performance.
Comparison methods:
We selected five clustering methods without dimension reduction, i.e., regularized k-means (RKM) [Lin et al., 2019], Ksum [Pei et al., 2023], Ksum-x [Pei et al., 2023], Kmeans [Hartigan and Wong, 1979], CDKM [Nie et al., 2022] for comparison. Besides, to effectivelyly evaluate model performance, we also compare our method with another five clustering methods with subspace learning, including two methods of dimensionality reduction before clustering: PCA [Turk and Pentland, 1991]+K-means and LPP [He and Niyogi, 2003]+K-means, and three unsupervised LDA methods: LDA-Km [Ding and Li, 2007], Un-RTLDA, and UnTRLDA [Wang et al., 2023].
4.3 Clustering Performance
The experimental results of our proposed method and ten comparison methods in seven benchmark datasets are shown in Table 2. Our proposed method can achieve the best clustering result for the ORL dataset when λ is 0.08, and the remaining six datasets FaceV5, Isolet, JAFFE, MSRC V2, UMIST and Yaleface have the best clustering performance when λ is equal to or close to 0.05. Moreover, the different dimensions of the subspace will also affect the clustering results, so We sequentially select the subspace dimensions ranging from 150 to the dimension d of data X with an interval of 20 for traversal. In both the comparison methods and our method, to ensure accuracy, we repeat the experiment ten times and then take the maximum value.
In the tables, we use two different distance measures, square Euclidean distance and Butterworth filter distance, to verify the performance of our method, where "ours" represents the results of square Euclidean distance and "ours(btw)" represents the results of Butterworth filter distance. The anchor rate and Ω of FaceV5, JAFFE, MSRC V2, ORL, UMIST and Yaleface datasets are 0.08 and 0.01, while the anchor rate and Ω of Isolet datasets are 0.08 and 0.001. It can be seen that our method has obvious advantages when using Butterworth filter distance and can achieve better results.
| Methods | Metric | K- means | RKM | Ksum | Ksum-x | PCA | LPP | LDA -Km | Un-RT LDA | Un-TR LDA | CDKM | Ours | Ours (btw) |
|---|---|---|---|---|---|---|---|---|---|---|---|---|---|
| FaceV5 | ACC | 0.7633 | 0.8540 | 0.9676 | 0.9620 | 0.7792 | 0.7640 | 0.8096 | 0.7644 | 0.8196 | 0.8422 | 0.9664 | 0.9688 |
| NMI | 0.9369 | 0.9563 | 0.9893 | 0.9857 | 0.9366 | 0.9393 | 0.9516 | 0.9247 | 0.9556 | 0.9624 | 0.9877 | 0.9899 | |
| Purity | 0.8114 | 0.8640 | 0.9709 | 0.9659 | 0.8192 | 0.8116 | 0.8404 | 0.7864 | 0.8512 | 0.8796 | 0.9688 | 0.9704 | |
| Isolet | ACC | 0.5776 | 0.7186 | 0.6856 | 0.6593 | 0.6513 | 0.6994 | 0.7160 | 0.7872 | 0.3660 | 0.6014 | 0.7385 | 0.8109 |
| NMI | 0.7406 | 0.7785 | 0.7727 | 0.7721 | 0.7699 | 0.8166 | 0.8209 | 0.8339 | 0.5386 | 0.7561 | 0.8137 | 0.8413 | |
| Purity | 0.6265 | 0.7186 | 0.6979 | 0.6775 | 0.6795 | 0.7333 | 0.7526 | 0.8038 | 0.3923 | 0.6478 | 0.7590 | 0.8109 | |
| JAFFE | ACC | 0.7085 | 0.8310 | 0.8789 | 0.8930 | 0.8873 | 0.9765 | 0.9577 | 0.9671 | 0.9155 | 0.7108 | 0.9859 | 1.0000 |
| NMI | 0.8010 | 0.8159 | 0.8764 | 0.9013 | 0.9135 | 0.9740 | 0.9484 | 0.9625 | 0.9225 | 0.7981 | 0.9816 | 1.0000 | |
| Purity | 0.7455 | 0.8310 | 0.8789 | 0.8977 | 0.8873 | 0.9765 | 0.9577 | 0.9671 | 0.9155 | 0.7441 | 0.9859 | 1.0000 | |
| MSRC V2 | ACC | 0.6052 | 0.6286 | 0.7524 | 0.6852 | 0.6905 | 0.7238 | 0.7286 | 0.6714 | 0.7524 | 0.6657 | 0.8286 | 0.8667 |
| NMI | 0.5280 | 0.5612 | 0.6110 | 0.5753 | 0.6026 | 0.6245 | 0.5841 | 0.5482 | 0.6383 | 0.5693 | 0.7069 | 0.7527 | |
| Purity | 0.6276 | 0.6333 | 0.7524 | 0.6910 | 0.7190 | 0.7238 | 0.7286 | 0.6905 | 0.7524 | 0.6795 | 0.8286 | 0.8667 | |
| ORL | ACC | 0.5198 | 0.5000 | 0.6337 | 0.5877 | 0.5525 | 0.5500 | 0.5675 | 0.6625 | 0.6075 | 0.5507 | 0.6450 | 0.7375 |
| NMI | 0.7234 | 0.7143 | 0.7940 | 0.7690 | 0.7334 | 0.6917 | 0.7463 | 0.8159 | 0.7723 | 0.7529 | 0.7950 | 0.8462 | |
| Purity | 0.5705 | 0.5200 | 0.6562 | 0.6060 | 0.6025 | 0.5875 | 0.6100 | 0.6975 | 0.6450 | 0.6090 | 0.6750 | 0.7525 | |
| UMIST | ACC | 0.4339 | 0.4209 | 0.4209 | 0.4296 | 0.4643 | 0.4574 | 0.4991 | 0.4974 | 0.5009 | 0.4210 | 0.4783 | 0.6348 |
| NMI | 0.6410 | 0.5963 | 0.619 | 0.6377 | 0.6252 | 0.6620 | 0.6737 | 0.6932 | 0.6852 | 0.6404 | 0.6402 | 0.7652 | |
| Purity | 0.5110 | 0.4400 | 0.4553 | 0.4715 | 0.5183 | 0.5635 | 0.5530 | 0.5687 | 0.5617 | 0.5043 | 0.5252 | 0.6748 | |
| Yaleface | ACC | 0.3812 | 0.4485 | 0.4339 | 0.4418 | 0.4727 | 0.4000 | 0.4545 | 0.4727 | 0.4848 | 0.3964 | 0.4848 | 0.5091 |
| NMI | 0.4389 | 0.5099 | 0.4975 | 0.5018 | 0.5082 | 0.4298 | 0.5084 | 0.5210 | 0.5265 | 0.4779 | 0.5418 | 0.5318 | |
| Purity | 0.4030 | 0.4848 | 0.4733 | 0.4915 | 0.4727 | 0.4242 | 0.4727 | 0.4970 | 0.5030 | 0.4188 | 0.4909 | 0.5273 |


When Euclidean square distance is used, the clustering results of Isolet, JAFFE, MSRC V2, ORL, UMIST and Yaleface are better than those of the five pure clustering algorithms, which shows that our method effectively improves the performance of clustering. At the same time, on the seven benchmark data, we also conducted the experiment of dimensionality reduction before clustering, and the results are as follows: PCA+K-means and LPP+K-means in the three tables. Our method has the same better effect, because our method is not a simple method of dimensionality reduction before clustering, but a unity of both, and adopts a centerless clustering method. Therefore, our method breaks through the limitations of traditional dimension reduction clustering and improves the clustering effect.

LDA's two unsupervised expansion methods, LDA-Km and Un-RTLDA, Un-TRLDA, show high clustering results on seven benchmark datasets, though the Un-TRLDA method is difficult to converge on the dataset Isolet, so the clustering effect on this dataset is not accurate, which also shows that the combination of clustering process and subspace selection process, and the method of data clustering and subspace selection at the same time can effectively reduce the dimension disaster and greatly improve the clustering effect. However, after using Butterworth filter distance, the clustering performance of our method exceeds all the above comparison methods. This is because Butterworth filter distance adopts the nonlinear mapping method and uses prior adjacency graph information, which can better process data and mine data information, thus improving the clustering accuracy more effectively.
4.4 T-SNE Visualization
Figure 2 shows the results of T-SNE visualizations of different algorithms on the JAFFE dataset, each of which divides the JAFFE dataset into ten clusters. The Figure 2.(a) shows the true labels of the JAFFE dataset, and the Figure 2.(b)-(e) show the labels obtained by the comparison clustering algorithms, and the Figure 2.(f) shows the visualization of our method. It can be observed that our method distinctly separates ten samples with clear boundaries, whereas the four comparative algorithms all tend to group samples that are close but belong to two different clusters into one. This is because our method incorporates LDA for dimensionality reduction, performing clustering in the subspace to enhance clustering performance. Additionally, by calculating the distances between sample pairs rather than the distance from samples to cluster centroids, our approach is better equipped to handle nonlinear data.
4.5 Parameter Analysis
Figure 3 illustrates the impact of the parameter λ, with values of 0.0001, 0.001, 0.01, 0.1, and 1, on the clustering performance across six datasets. By examining the three evaluation metrics ACC, NMI, and Purity, it is evident that variations in λ affect the clustering performance on Isolet and MSRC V2 datasets. Different datasets exhibit varying trends in these metrics as λ increases, indicating that the sensitivity of clustering performance to λ values differs among the datasets. These findings suggest that selecting an appropriate λ value is crucial to optimize clustering performance in specific datasets.
4.6 Convergence Analysis
Furthermore, an experiment was conducted to assess the convergence of our method by observing the objective function across multiple iterations on six benchmark datasets. The experimental results, depicted in Figure 4, indicate that our method consistently reaches a stable objective function value with minimal iterations across diverse datasets, thus affirming its strong convergence performance.
5 Conclusion
In this paper, we propose a novel unsupervised discriminative dimension reduction method that successfully integrates the centerless K-means algorithm with Linear Discriminant Analysis (LDA) into a unified framework. This approach not only eliminates the reliance on cluster centroids, which is common in traditional clustering algorithms, thereby enhancing the robustness of the model, but also explores the local neighborhood structure of the data. Additionally, we construct a similarity matrix using a learnable label matrix, which maintains both the neighboring relationships and the cluster structure relationships. Furthermore, by incorporating the Butterworth filter distance to handle nonlinear data, the applicability of the model is further enhanced. The experimental results of our framework on multiple benchmark datasets demonstrate the method's excellent performance in unsupervised dimension reduction and clustering tasks, effectively capturing both the discriminative structure and the local neighborhood structure of the data.
Acknowledgments
This work is supported by the National Natural Science Foundation of China under Grant 62176203, the Fundamental Research Funds for the Central Universities (ZYTS25267, QTZX25004), and the Science and Technology Project of Xi'an (Grant 2022JH-JSYF-0009), Open Project of Anhui Provincial Key Laboratory of Multimodal Cognitive Computation, Anhui University (No. MMC202416), Selected Support Project for Scientific and Technological Activities of Returned Overseas Chinese Scholars in Shaanxi Province 202302, and the Xidian Innovation Fund (Project NoYJSJ25007).
@inproceedings{ijcai2025p709,
  title     = {Enhanced Unsupervised Discriminant Dimensionality Reduction for Nonlinear Data},
  author    = {Wang, Qianqian and Jiang, Mengping and Feng, Wei and Ding, Zhengming},
  booktitle = {Proceedings of the Thirty-Fourth International Joint Conference on
               Artificial Intelligence, {IJCAI-25}},
  publisher = {International Joint Conferences on Artificial Intelligence Organization},
  editor    = {James Kwok},
  pages     = {6370--6378},
  year      = {2025},
  month     = {8},
  note      = {Main Track},
  doi       = {10.24963/ijcai.2025/709},
  url       = {https://doi.org/10.24963/ijcai.2025/709},
}
TY - CPAPER TI - Enhanced Unsupervised Discriminant Dimensionality Reduction for Nonlinear Data AU - Wang, Qianqian AU - Jiang, Mengping AU - Feng, Wei AU - Ding, Zhengming T2 - Proceedings of the Thirty-Fourth International Joint Conference on Artificial Intelligence, IJCAI-25 PB - International Joint Conferences on Artificial Intelligence Organization PY - 2025 SP - 6370 EP - 6378 DO - 10.24963/ijcai.2025/709 UR - https://doi.org/10.24963/ijcai.2025/709 ER -Copied
Machine-readable versions of this paper, for tools and AI agents:





