
Graph OOD Detection via Plug-and-Play Energy-based Evaluation and Propagation
Proceedings of the Thirty-Fourth International Joint Conference on Artificial Intelligence. Main Track. Pages 7065-7073.
https://doi.org/10.24963/ijcai.2025/786
Keywords
- Machine Learning: ML: Sequence and graph learning
- Data Mining: DM: Mining graphs
- Machine Learning: ML: Deep learning architectures
Abstract
Existing graph neural network (GNN) methods are typically built upon the i.i.d. assumption, emphasizing the enhancement of the test performance for in-distribution (ID) data. However, there has been limited exploration of their adaptability to scenarios involving unknown distribution data. On the one hand, in real-world application scenarios, graph data often expands continuously with the acquisition of external knowledge, which means that new nodes with unknown categories may be added to the graph data. The gap between the new node distribution and the original node distribution can make existing GNN methods less effective. On the other hand, existing out-of-distribution (OOD) detection methods often rely on the softmax confidence score, which makes the OOD data suffer from overconfident posterior distributions. To address the above issues, we propose an Energy Propagation-based Graph Neural Network (EPGNN), which improves the OOD generalization ability by endowing GNN with the capacity to detect the OOD nodes in the graph. Specifically, we first construct GNN encoder to obtain node embedding that incorporates neighborhood structural information. Then, we design a plug-and-play energy-based OOD evaluator by assigning corresponding energy values to different nodes. Finally, we construct a plug-and-play structure-aware energy propagation module and joint alignment regularization, which make the node energy more flexible during the training process. Extensive experiments on benchmark datasets demonstrate the superiority of our method.
- [Abdi et al., 2024] Lemar Abdi, M. M. Amaan Valiuddin, Christiaan G. A. Viviers, Peter H. N. de With, and Fons van der Sommen. Typicality excels likelihood for unsu- pervised out-of-distribution detection in medical imaging. In Proceedings of the 6th Uncertainty for Safe Utilization of Machine Learning in Medical Imaging, pages 149-159, Marrakesh, Morocco, October 2024. Springer.
- [Arbel et al., 2021] Michael Arbel, Liang Zhou, and Arthur Gretton. Generalized energy based models. In Proceed- ings of the 9th International Conference on Learning Rep- resentations, Virtual Event, May 2021. OpenReview.net. Brody et al., 2022]
- Shaked Brody, Uri Alon, and Eran Ya- hav. How attentive are graph attention networks? In Pro- ceedings of the 10th International Conference on Learn- ing Representations, Virtual Event, April 2022. OpenRe- view.net.
- [Cui et al., 2023] Jiali Cui, Ying Nian Wu, and Tian Han. Learning hierarchical features with joint latent space energy-based prior. In Proceedings of the International Conference on Computer Vision, pages 2218-2227, Paris, France, October 2023. IEEE.
- [Du et al., 2020] Yilun Du, Shuang Li, and Igor Mordatch. Compositional visual generation with energy based mod- els. In Proceedings of the Annual Conference on Neural Information Processing Systems, virtual, December 2020.
- [Gao et al., 2020] Ruiqi Gao, Erik Nijkamp, Diederik P. Kingma, Zhen Xu, Andrew M. Dai, and Ying Nian Wu. Flow contrastive estimation of energy-based models. In Proceedings of the Conference on Computer Vision and Pattern Recognition, pages 7515-7525, Seattle, WA, USA, June 2020. Computer Vision Foundation / IEEE.
- [Guo et al., 2022] Kai Guo, Kaixiong Zhou, Xia Hu, Yu Li, Yi Chang, and Xin Wang. Orthogonal graph neural net- works. In Proceedings of the 36th AAAI Conference on Ar- tificial Intelligence, pages 3996-4004. AAAI Press, 2022.
- [Hamilton et al., 2017] William L. Hamilton, Zhitao Ying, and Jure Leskovec. Inductive representation learning on large graphs. In Proceedings of the Annual Conference on Neural Information Processing Systems, pages 1024- 1034, Long Beach, CA, USA, December 2017.
- [Hendrycks and Gimpel, 2017] Dan Hendrycks and Kevin Gimpel. A baseline for detecting misclassified and out-of- distribution examples in neural networks. In Proceedings of the 5th International Conference on Learning Represen- tations, Toulon, France, April 2017. OpenReview.net.
- [Hendrycks et al., 2019] Dan Hendrycks, Mantas Mazeika, and Thomas G. Dietterich. Deep anomaly detection with outlier exposure. In Proceedings of the 7th International Conference on Learning Representations, New Orleans, LA, USA, May 2019. OpenReview.net.
- [Hoffmann et al., 2023] Marcel Hoffmann, Lukas Galke, and Ansgar Scherp. Open-world lifelong graph learning. In Proceedings of the International Joint Conference on Neural Networks, pages 1-9, Gold Coast, Australia, June 2023. IEEE.
- [Hsu et al., 2020] Yen-Chang Hsu, Yilin Shen, Hongxia Jin, and Zsolt Kira. Generalized ODIN: detecting out-of-distribution image without learning from out-of- distribution data. In Proceedings of the Conference on Computer Vision and Pattern Recognition, pages 10948- 10957, Seattle, WA, USA, June 2020.
- [Hu et al., 2021] Yang Hu, Haoxuan You, Zhecan Wang, Zhicheng Wang, Erjin Zhou, and Yue Gao. Graph-mlp: Node classification without message passing in graph. CoRR, abs/2106.04051, 2021.
- [Juan et al., 2024] Xin Juan, Xiao Liang, Haotian Xue, and Xin Wang. Multi-strategy adaptive data augmentation for graph neural networks. Expert Syst. Appl., 258:125076, 2024.
- [Kipf and Welling, 2017] Thomas N. Kipf and Max Welling. Semi-supervised classification with graph convolutional networks. In Proceedings of the 5th International Confer- ence on Learning Representations, Toulon, France, April 2017. OpenReview.net.
- [Liang et al., 2018] Shiyu Liang, Yixuan Li, and R. Srikant. Enhancing the reliability of out-of-distribution image de- tection in neural networks. In Proceedings of the 6th In- ternational Conference on Learning Representations, Van- couver, BC, Canada, April 2018. OpenReview.net.
- [Liu et al., 2020] Meng Liu, Hongyang Gao, and Shuiwang Ji. Towards deeper graph neural networks. In Proceedings of the 26th Conference on Knowledge Discovery and Data Mining, pages 338-348. ACM, 2020.
- [Pang et al., 2021] Bo Pang, Tianyang Zhao, Xu Xie, and Ying Nian Wu. Trajectory prediction with latent belief energy-based model. In Proceedings of the Conference on Computer Vision and Pattern Recognition, pages 11814- 11824, virtual, June 2021. Computer Vision Foundation / IEEE.
- [Peng et al., 2024] Tianshuo Peng, Zuchao Li, Ping Wang, Lefei Zhang, and Hai Zhao. A novel energy based model mechanism for multi-modal aspect-based sentiment analy- sis. In Proceedings of the 38th AAAI Conference on Artifi- cial Intelligence, pages 18869-18878, Vancouver, Canada, February 2024. AAAI Press.
- [Salehi et al., 2022] Mohammadreza Salehi, Hossein Mirzaei, Dan Hendrycks, Yixuan Li, Mohammad Hossein Rohban, and Mohammad Sabokrou. A unified survey on anomaly, novelty, open-set, and out of-distribution detection: Solutions and future challenges. Trans. Mach. Learn. Res., 2022, 2022.
- [Schmarje et al., 2024] Lars Schmarje, Kaspar Sakman, Reinhard Koch, and Dan Zhang. UNCOVER: unknown class object detection for autonomous vehicles in real- time. CoRR, abs/2412.03986, 2024.
- [Shen et al., 2024] Xu Shen, Yili Wang, Kaixiong Zhou, Shirui Pan, and Xin Wang. Optimizing OOD detection in molecular graphs: A novel approach with diffusion mod- els. In Proceedings of the 30th Conference on Knowledge Discovery and Data Mining, pages 2640-2650. ACM, 2024.
- [Song and Kingma, 2021] Yang Song and Diederik P. Kingma. How to train your energy-based models. CoRR, abs/2101.03288, 2021.
- [Song and Wang, 2022] Yu Song and Donglin Wang. Learn- ing on graphs with out-of-distribution nodes. In Proceed- ings of the 28th conference on Knowledge Discovery and Data Mining, pages 1635-1645, Washington, DC, USA, August 2022. ACM.
- [Sun et al., 2022] Yiyou Sun, Yifei Ming, Xiaojin Zhu, and Yixuan Li. Out-of-distribution detection with deep nearest neighbors. In Proceedings of the 39th International Con- ference on Machine Learning, pages 20827-20840, Balti- more, Maryland, USA, July 2022. PMLR.
- [Tang et al., 2008] Jie Tang, Jing Zhang, Limin Yao, Juanzi Li, Li Zhang, and Zhong Su. Arnetminer: extraction and mining of academic social networks. In Proceedings of the 14th International Conference on Knowledge Discov- ery and Data Mining, pages 990-998, Las Vegas, Nevada, USA, August 2008. ACM.
- [Tu et al., 2020] Lifu Tu, Richard Yuanzhe Pang, Sam Wise- man, and Kevin Gimpel. ENGINE: energy-based infer- ence networks for non-autoregressive machine translation. In Proceedings of the 58th Annual Meeting of the Associa- tion for Computational Linguistics, pages 2819-2826, On- line, July 2020. Association for Computational Linguis- tics.
- [Velickovic et al., 2017] Petar Velickovic, Guillem Cucurull, Arantxa Casanova, Adriana Romero, Pietro Liò, and Yoshua Bengio. Graph attention networks. CoRR, abs/1710.10903, August 2017.
- [Wu et al., 2023] Qitian Wu, Yiting Chen, Chenxiao Yang, and Junchi Yan. Energy-based out-of-distribution detec- tion for graph neural networks. In Proceedings of the 11th International Conference on Learning Representa- tions, Kigali, Rwanda, May 2023. OpenReview.net.
- [Xu et al., 2019] Keyulu Xu, Weihua Hu, Jure Leskovec, and Stefanie Jegelka. How powerful are graph neural net- works? In Proceedings of the 7th International Con- ference on Learning Representations, New Orleans, LA, USA, May 2019. OpenReview.net.
- [Yang et al., 2024a] Cheng Yang, Guoping Huang, Mo Yu, Zhirui Zhang, Siheng Li, Mingming Yang, Shuming Shi, Yujiu Yang, and Lemao Liu. An energy-based model for word-level autocompletion in computer-aided translation. Trans. Assoc. Comput. Linguistics, 12:137-156, 2024.
- [Yang et al., 2024b] Jingkang Yang, Kaiyang Zhou, Yixuan Li, and Ziwei Liu. Generalized out-of-distribution detec- tion: A survey. Int. J. Comput. Vis., 132(12):5635-5662, 2024.
References were extracted automatically from the PDF and may contain errors.
Full text extracted automatically from the PDF; figures, tables and equations may differ. The PDF is the version of record.
1 Introduction
Graph neural networks (GNN) have emerged as a powerful framework for analyzing and modeling complex relationships and structures in various domains [Liu et al., 2020], [Guo et al., 2022], [Juan et al., 2024]. In general, GNN aggregates information from the connecting neighbor nodes and generates smooth embedding of the center node. Therefore, by capturing the complex dependencies and relationships among nodes, GNN possesses powerful non-Euclidean embedding and complex pattern mining capabilities, which enable GNN to play a crucial role in numerous practical graph data mining applications and tasks. GraphSAGE [Hamilton et al., 2017] employs an adaptive neighbor sampling strategy to update the embedding of a node by sampling neighbor nodes at each layer and then aggregating the features of the neighbors. GAT [Velickovic et al., 2017] captures the important relationships between nodes by introducing attention mechanism that dynamically learns the weights between a node and its neighbors. GIN [Xu et al., 2019] aggregates the neighbor information at each hop and then mixes and adjusts them with the node's original features by introducing learnable parameters, thereby obtaining the expressive node embedding.
∗Corresponding Author
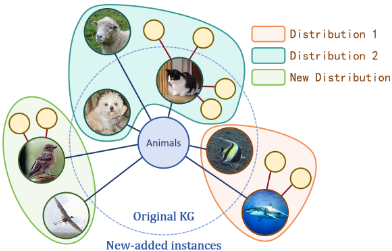
However, existing methods still suffer from the following limitations. On the one hand, they are generally designed based on the independently and identically distributed (i.i.d.) assumption, which means that the training and test data are drawn from the same distribution. Under this assumption, GNN considers that all data follows the same distribution, ignoring distinct characteristics and complex patterns across distributions. In real-world scenarios, graph data tends to expand continuously with the acquisition of external knowledge, which implies that new nodes with unknown categories may be added. For instance, in knowledge graph scenario, the new entities and relationships may be discovered along with the knowledge enhancement, necessitating the integration of these new nodes into the existing graph structure (as shown in Figure 1). The addition of these new nodes with unknown categories forces GNN models to be equipped to handle this uncertainty and learn from the continuously evolving graph data. On the other hand, although some methods attempt to identify OOD data within the dataset, they often rely on the softmax confidence scores. However, the softmax posterior distribution assumes every input belongs to an observed class. Even if the input is OOD, softmax may still assign high confidence to incorrect labels, leading to overconfident posteriors for OOD data. In contrast, the energy-based model can map each node embedding into a common scalar space that is lower for observed node instances and higher for unobserved ones. Intuitively, the energy scores of nodes are theoretically aligned with the probability density of the input, which is less susceptible to the overconfidence problem. Therefore, constructing an energy function with strong adaptability is crucial for the model to recognize OOD nodes.
To address the above limitations, we propose Energy Propagation-based Graph Neural Network (EPGNN), which enhances OOD generalization by leveraging energy-based model for identifying OOD nodes within the graph. Specifically, to capture the intricate node dependencies, we initially construct GNN encoder to generate node embeddings that incorporate neighborhood structural information. This makes the node embedding contain rich semantic and structural information about each local environment. Then, to distinguish nodes from different distributions, we design a plug-and-play energy-based OOD evaluator. This evaluator is meticulously designed with an energy function to generate energy scores that are theoretically aligned with the probability density of the input nodes. We assign specific energy values to various nodes, which helps the model delineate the distributional attributes of the nodes, thereby, the model can identify the node instances from previously unseen or unknown distributions. In addition, to further enhance the model's capability in detecting OOD data, we introduce a plug-and-play structureaware energy propagation module, which can increase the adaptability of node energy values as the training progresses. This makes the model more sensitive to the changes in the graph's structure and better equipped to refine its energybased node representations. Finally, we design joint alignment regularization, enabling the model to capture generalizable knowledge across different distributions, thereby improving the model's OOD generalization ability. Extensive experiments on benchmark datasets validate the superiority of EPGNN. Our contribution can be summarized as follows:
- We propose the Energy Propagation-based Graph Neural Network (EPGNN), which enhances OOD generalization capabilities by utilizing an energy-based approach to recognize OOD nodes within the graph.
- We design an energy function to generate energy values that are consistent with the probability density distribution of the input nodes, which makes the model distinguish the ID and OOD nodes.
- We conduct extensive experiments on three benchmark datasets to demonstrate the effectiveness of EPGNN.
2 RelatedWork
2.1 Out-of-distribution Detection
The goal of OOD detection [Yang et al., 2024b], [Salehi et al., 2022], [Shen et al., 2024] is to identify input samples that do not belong to the model's training distribution. OOD detection is widely used in applications such as autonomous driving [Schmarje et al., 2024] and medical diagnosis [Abdi et al., 2024]. MSP [Hendrycks and Gimpel, 2017] demonstrates that ID samples often have larger maximum softmax probability than OOD samples, allowing the use of the maximum softmax probability to detect OOD samples. ODIN [Liang et al., 2018] employs temperature scaling to better separate the softmax probability between ID and OOD samples and adds perturbations to the input to enhance the effectiveness of the OOD detection method. GODIN [Hsu et al., 2020] proposes decomposed confidence scoring to simulate the difference in confidence distribution between OOD and ID samples and improves the input preprocessing method. KNN+ [Sun et al., 2022] explores the effectiveness of non-parametric nearest neighbor distance in OOD detection, achieving OOD detection without imposing any distributional assumptions. OE [Hendrycks et al., 2019] leverages an auxiliary dataset of outliers to enhance the ability to recognize and classify unknown distribution data. GOOD [Hoffmann et al., 2023] proposes a weakly supervised relevance feedback method that diminishes the dependence on thresholds in OOD detection. OODGAT [Song and Wang, 2022] leverages graph connectivity patterns to provide information for better OOD detection.
2.2 Energy-basedModel
Energy-based models (EBMs) [Song and Kingma, 2021], [Arbel et al., 2021] compute energy values using an energy function to capture variable dependencies. These energy values can be viewed as a measure of the discrepancy between a sample and the distribution expected by the model. EBMs are widely used in various practical applications, such as image processing [Peng et al., 2024] and natural language processing [Yang et al., 2024a]. LB-EBM [Pang et al., 2021] leverages EBM to achieve multimodal trajectory prediction. ENGINE [Tu et al., 2020] leverages an energy-based approach to train non-autoregressive translation models, thereby achieving efficient performance. EBM-FCE [Gao et al., 2020] proposes a joint training method for combining an EBM with a flow model, which enhances unsupervised feature learning while enabling adaptation to semi-supervised learning. Cui et al. [Cui et al., 2023] effectively learn hierarchical representations by combining the strengths of Latent Space EBM and multi-layer generative models. Du et al. [Du et al., 2020] leverages an energy-based approach to construct a generative model for better inference.
3 Problem Statement
Given a graph G = (V, E), where V denotes the node set and E denotes the edge set. The graph structure is represented by a binary adjacency matrix A ∈ {0, 1}|V |×|V | , where each element Aij = 1 if the connection exists between vertices vi ∈ V and vj ∈ V , otherwise Aij = 0. Each node v ∈
V is associated with a feature vector x and a one-hot label vector y. The overall feature matrix and class matrix can be represented by X = {xi}|V | i=0 and Y = {yi}|V | i=0 , respectively.
The traditional graph mining methods often assume that all data instances obey the same distribution (i.e., i.i.d. assumption), and they can access all kinds of categories. Unlike the traditional graph learning process, in real-world scenarios, we often have limited access to all data labels, and the underlying data distributions become increasingly diverse as the data accumulates. This process can be defined as follows:
where V new denotes the expanded OOD nodes with unseen labels, Enew denotes the new added edges. Hence, our goal is to enhance traditional graph mining methods with some plug-and-play modules that enable rapid identification of new OOD nodes. Specifically, we aim to construct a graph representation learning fθ(·) that can effectively utilize its learned knowledge to detect OOD nodes V new during the learning process, which can be defined as follows:
where V new denotes the OOD nodes in Gnew .
4 Energy Propagation-based Graph Neural Network
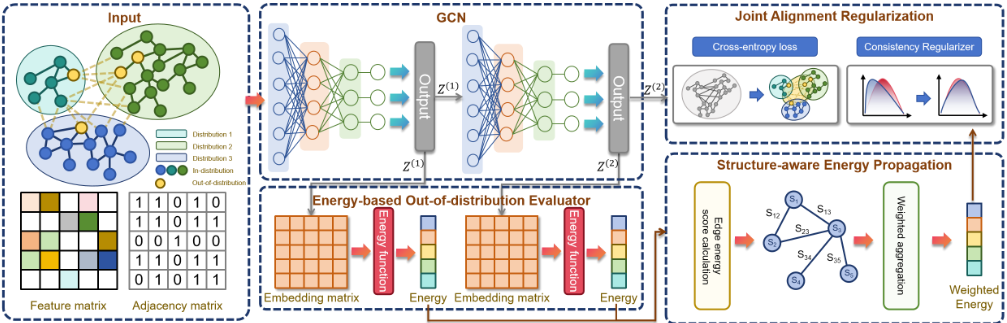
In this section, we introduce the fundamental components of our framework: energy-based out-of-distribution evaluator, structure-aware energy propagation, and joint alignment regularization. In addition, we provide a description of the overall optimization objective of our framework. Our framework diagram is illustrated in Figure 2.
4.1 Energy-based Out-of-distribution Evaluator
In this subsection, we introduce the main components of the plug-and-play energy-based out-of-distribution evaluator.
Graph Representation Learning Backbone
Considering that in real-world application scenarios, the node diversity in a graph typically expands continuously with the increase of nodes. Given a graph G, we first design a data set partitioning strategy to simulate OOD scenarios. Specifically, we select a portion of the node categories in graph G as the source node set, which constitutes the main data distribution that the model encounters during the training phase. At the same time, the remaining node categories in the graph are designated as the OOD node set, which represents a test environment that is different from the training distribution, thus simulating a scene of OOD generalization. The data set partition process can be defined as follows:
where V denotes the node set of input graph G, V S and V T denote the selected source and OOD node set, respectively, and C S and C T denote the source node categories set and OOD node categories. We respectively assign meta-labels to the nodes in V S and V T , namely "source node" and "OOD node". Then, we construct the GNN embedding layer by aggregating the local neighboring structure information to the corresponding center node, and we construct the graph representation learning backbone fθ(·) by leveraging a series of GNN embedding layers. The forward process of node v at k-th layer f (k) θk (·) can be defined as follows:
where h(k) v denotes the embedding of node v at the k-th layer, w is a learnable parameter, σ is a non-linear activation function (e.g., Sigmoid), N(v) denotes the neighbors of node v, and AGG is the aggregate function. Subsequently, we feed the selected source and simulated OOD node set V S and V T into fθ for obtaining the node embedding matrix, where the output at k-th layer can be defined as follows:
where f (k) θk denotes the k-th layer of graph representation learning backbone, GS and GT denote the sampled subgraphs by using V S and V T respectively. Z (k) S and Z (k) T denote the output node embedding matrices of the GS and GT , where their meta-labels are "source node" and "OOD node" respectively. Finally, we concat the Z (k) S and Z (k) T for obtain the final output Z (k) = [Z (k) S ||Z (k) T ] at k-th layer.
Energy Function Construction
Because the core task of the model is to capture and understand the implicit differences between the source node set and the OOD node set, thereby the model can learn the internal relationships among the various node distributions. This requires the model to not only parse the characteristics of each individual category in depth but also to identify and understand the interrelationships and differences between different categories. Therefore, the model can be more robust and flexible, effectively extracting useful feature information when dealing with OOD data. For this purpose, we design an energy-based function E(·), which maps the node embedding into a scalar called energy to indicate whether a node belongs to OOD nodes, which can be defined as follows:
where vi denotes the input node instance of original graph G, Gego vi denotes the r-ego subgraph centered by vi, fθ denotes the graph representation learning backbone, C = {c1, · · · , cN} denotes the category labels of source node set, fθ (vi, Gego vi )[j] denotes the j-th column of the output, and T denotes the temperature parameter. In this function, for ID data, the model typically assigns significantly higher logit values to one category, resulting in lower energy. For OOD data, since the model is more uncertain about its class prediction, the logits distribution tends to approach a uniform distribution, leading to higher energy. This function extracts the energy of the node directly from the fθ, without affecting the backbone itself. By adding this plug-and-play energy-based OOD evaluator, the model gains the ability to differentiate between ID and OOD nodes.
4.2 Structure-aware Energy Propagation
We design plug-and-play structure-aware energy propagation to enhance the significance of the energy difference between different distribution nodes. Specifically, we aggregate the neighboring node energy values to the target node. In this process, a reasonable approach is to assign higher weights to the neighbor nodes with the same distribution as the target node. Conversely, the neighbor nodes with other distributions should have a smaller influence on energy aggregation, hence assigned with lower weights. This way, the energy values can better reflect the distribution differences between nodes. To realize the energy propagation process, we introduce an edge energy score to quantify the neighboring node weights, which can be defined as follows:
where slij denotes the edge energy score of adjacent nodes vi and vj, sli and slj are the node energy scores of vi and vj at layer l. Then, we aggregate the node energy scores and edge energy scores to update the target node energy score, the update process can be defined as follows:
where sli is the energy score of node i, N(vi) is the neighbor node set. By adding this plug-and-play structure-aware energy propagation module to the energy-based OOD evaluator, we can not only strengthen the energy connections between nodes of the same distribution but also weaken the energy transfer between nodes of different distributions. This increases the energy disparity between nodes of varying distributions, thereby optimizing the energy distribution characteristics of the entire network and enhancing the stability and efficiency of the network.
4.3 Joint Alignment Regularization
To enhance the precision and robustness of node energy assessment, we design the joint alignment regularization. Our objective is to fine-tune node energy scores to further quantify the energy discrepancies among nodes within the graph. In addition, considering that the entropy of the output distribution generated by the graph representation learning backbone is a favorable measure of the disorder of the data distribution, it can reveal deviations between the data distribution and the training distribution. A higher entropy indicates that the model is encountering unknown data patterns (i.e., OOD samples), and a lower entropy suggests that the model is dealing with familiar patterns from the training set. By calculating the entropy of sample outputs, we can monitor whether the sample distribution deviates from the normal range. We leverage the final output entropy to guide the fine-tuning process. The entropy is defined as follows:
where vi denotes a target node, Gego vi denotes the r-ego subgraph centered by vi, fθ denotes the graph representation learning backbone, C = {c1, · · · , cN} is the label set. The computation of entropy not only serves as an auxiliary tool for identifying OOD samples but also helps maintain the stability and reliability of the model when dealing with unseen data. Hence, we design the joint alignment regularization to harmonize the relationship between energy scores and output entropy. The core of the regularization is to minimize the discrepancy between output entropy and energy scores, ensuring consistency in predictions and preventing biases in energy assessment. Formally, the discrepancy between output entropy and energy scores of the each layer can be defined as follows:
where ˆs = [ˆ s1, · · · , ˆ s|V |]⊤ and ˆe = [ˆ e1, · · · , ˆ e|V |]⊤ is the normalized node energy score vector and entropy vector respectively. The normalization process is defined as follows:
| Dataset | OOD classes | ID size | OOD size | train-ID | val-ID | test-ID | train-OOD | val-OOD | test-OOD |
|---|---|---|---|---|---|---|---|---|---|
| Cora | 0, 1, 2, 3 | 904 | 1804 | 6.64% | 18.47% | 34.96% | 4.43% | 18.46% | 37.92% |
| Citeseer | 0, 1, 2 | 1805 | 1522 | 9.97% | 9.97% | 80.06% | 9.99% | 9.99% | 80.03% |
| Coauthor-CS | 0, 1, 2, 3, 4 | 13290 | 5043 | 10.00% | 10.00% | 80.00% | 9.99% | 9.99% | 80.01% |
where µs and µe are the mean energy score and entropy across all nodes, respectively, and σs and σe are the standard deviations of the energy scores and entropy values, respectively. Then, the final joint alignment loss is calculated by first determining the discrepancy between the output entropy of the last layer and the energy scores of each individual layer, and then averaging these differences across all k layers:
where ˆsi is the normalized node energy score vector for the i-th layer, and ˆ e is the normalized entropy vector of the last layer. This formulation ensures that the joint alignment loss considers the consistency between the entropy and energy scores across all layers of the model. By adopting this method, we not only ensure the synergy between energy scores and output entropy, meaning that both metrics should yield similar predictive results across all nodes, but also uncover the intrinsic connection between energy scores and the final layer outputs of the model. During training, energy scores and output entropy exhibit a mutually restrictive and co-evolving relationship. The joint alignment regularization ensures that both metrics maintain a uniform trend throughout the training process, narrowing the model's hypothesis space. This makes it more likely for gradient descent algorithms to converge on solutions closer to reality, thereby enhancing the model's accuracy in node energy assessment and its discriminative power across nodes with different distributions, thereby improving its generalization capability. Finally, we further classify ID nodes, and the overall joint optimization objective of EPGNN can be defined as follows:
where CE(·, ·) denotes the cross-entropy loss function, a ∈ [0, 1] is a number that controls the decay of the regularization weight, t is the number of iteration steps, β is the hyperparameter that controls the strength of regularization term.
5 Experiments
To verify the effectiveness of EPGNN, we try to answer the following questions:
- Q1: How does EPGNN compare to other baseline methods in terms of OOD node detection and ID node classification performance?
- Q2: How do the various modules within EPGNN affect the model's performance?
- Q3: How do the hyperparameters of EPGNN influence the experimental outcomes?
5.1 Experimental Setup
Datasets and splits
We utilize three classic node classification datasets for evaluating the effectiveness of our framework, including citation networks [Kipf and Welling, 2017] (i.e., Cora, Citeseer), and academic network [Tang et al., 2008] (i.e., Coauthor-CS). In practice, new node classes are often unpredictable. Randomly selecting categories as OOD nodes can better simulate the unknown categories a model might encounter in real scenarios. We divide the original dataset based on node categories, where we select a node subset that is in the candidate categories as ID instances and make the remaining nodes as OOD instances. Specifically, the partition details are in Table 1.
Baselines
To assess the effectiveness of our proposed OOD node detection framework EPGNN, we compare it with both methods that rely on softmax probability scores and methods specifically designed for OOD detection. The baseline methods are introduced as follows:
- MLP [Hu et al., 2021] is a feedforward neural network that does not take into account structural information.
- GCN [Kipf and Welling, 2017] is a graph neural network that operates by aggregating features from neighboring and capturing the graph's structural information.
- GraphSAGE [Hamilton et al., 2017] is a graph neural network that learns a node's representation by sampling and aggregating features from its local neighbors.
- GAT [Velickovic et al., 2017] leverages attention mechanisms to weigh the importance of different neighbors' contributions when aggregating node features, enhancing its ability to focus on relevant nodes in a graph.
- GATv2 [Brody et al., 2022] introduces a more flexible and dynamic attention mechanism and addresses the limitation of GAT's static attention allocation.
- OE [Hendrycks et al., 2019] is an OOD detection method originally developed for computer vision tasks, which identifies OOD samples by modeling the uncertainty in the prediction scores.
- GNNSafe++ [Wu et al., 2023] is a method specifically designed for OOD node detection in graph-structured data. It employs the energy propagation technique but does not consider blocking the propagation of energy between data with different distributions.
| Cora | Citeseer | Coauthor-CS | |||||||
|---|---|---|---|---|---|---|---|---|---|
| Method | AUROC | AUPR | Acc | AURPC | AUPR | Acc | AUROC | AUPR | Acc |
| MLP | 72.31 | 58.20 | 76.58 | 71.53 | 75.37 | 80.83 | 82.23 | 92.51 | 91.42 |
| GCN | 83.99 | 74.43 | 91.50 | 83.04 | 83.80 | 86.02 | 88.38 | 95.30 | 92.34 |
| SAGE | 85.44 | 77.10 | 89.24 | 80.17 | 82.06 | 87.05 | 92.17 | 96.95 | 95.12 |
| GAT | 83.01 | 71.26 | 90.80 | 81.88 | 83.49 | 87.61 | 82.47 | 93.29 | 89.75 |
| GATv2 | 84.75 | 77.06 | 90.50 | 82.45 | 83.79 | 88.09 | 89.25 | 95.68 | 90.82 |
| OE | 89.63 | 77.19 | 88.29 | 74.28 | 64.67 | 82.32 | 96.47 | 98.67 | 95.01 |
| GNNSafe++ | 92.94 | 82.44 | 91.14 | 82.61 | 69.98 | 84.82 | 97.94 | 99.26 | 95.24 |
| EPGNN | 93.35 | 87.14 | 91.45 | 84.31 | 85.05 | 88.16 | 98.48 | 99.29 | 95.25 |
| Avg. Imp. | 10.95 | 19.06 | 4.09 | 6.47 | 10.08 | 3.48 | 10.06 | 3.54 | 2.67 |

For MLP, GCN, GraphSAGE, GAT, and GATv2, we utilize the maximum softmax probability as the OOD score for the nodes. For OE and GNNSafe++, we utilize the original OOD scores provided by the methods themselves.
Implementations and Metrics
We utilize a 2-layer GCN with 64 hidden units as the backbone encoder for EPGNN. The dropout probability is 0.7, and the learning rate is 0.01. We set the regularization weight decay coefficient a = 0.9 and the time factor coefficient b = 0.01. For the Cora dataset, the balance parameter for the joint alignment regularization and the temperature coefficient in the energy function is set to β = 1 and T = 3, respectively. For Citeseer, these parameters are β = 0.5 and T = 2, and for Coauthor-CS, they are β = 5 and T = 3. For the OOD node detection task, we use the AUROC and AUPR metrics, which are commonly used in OOD detection literature. Meanwhile, for ID node classification tasks, we use the accuracy (Acc) metric. During the training process, we set the maximum number of iterations to 2000, and we use early stopping when AUROC+Acc doesn't improve within 200 iterations. All experiments are done with PyTorch Geometric.
5.2 Performance Analysis
Analysis of Main Results
To answer question Q1, we present a comparison of different OOD node detection methods in Table 2. Our main observations are as follows:
- ❶ EPGNN is more robust in identifying OOD nodes and ID node classification. In terms of OOD detection, EPGNN
- achieves an average improvement of 9.16% in AUROC and 10.89% in AUPR against the baseline methods. For ID node classification, EPGNN surpasses the baseline methods by an average of 3.41% in Acc. The reason is that the energy score can effectively simulate the probability density distribution of the input nodes. Moreover, EPGNN excels in capturing graph structural information and the attributes of data with different distributions through energy propagation module. Additionally, EPGNN fosters synchronization between energy scores and output entropy through joint alignment regularization.
- ❷ Integrating graph structure into node representations enhances the distinction between ID and OOD nodes. Across all datasets, GCN significantly outperforms MLP, which does not consider graph topology. Since graph structural information exposes the intrinsic geometric structure of the data and the relationships between nodes, it is crucial for precisely capturing the complex interdependencies among nodes.
- ❸ Energy-based methods are more accurate and robust in distinguishing complex distribution data. Energy-based methods EPGNN and GNNSafe++ exhibit significant advantages over methods relying on softmax confidence. Due to the energy function mapping the energy of unobserved nodes to higher values, it aligns better with probability densities. This mapping mechanism reduces the problem of overconfidence and improves the accuracy of identifying OOD nodes.
- ❹ The energy propagation module is better at capturing distinctive attributes of variously distributed data. EPGNN outperforms GAT and GATv2. A key reason is that, unlike the traditional attention mechanism, the energy propagation module iteratively spreads the energy scores, which capture infor-
| Cora | Citeseer | Coauthor-CS | ||||
|---|---|---|---|---|---|---|
| Method | AUROC | AUPR | AURPC | AUPR | AUROC | AUPR |
| GCN | 80.44 | 66.61 | 80.57 | 82.44 | 89.38 | 95.39 |
| GCN+Align | 91.71 | 84.52 | 93.19 | 84.06 | 98.22 | 99.20 |
| GCN+Align+Pro | 93.35 | 87.14 | 84.31 | 85.05 | 98.48 | 99.29 |
| GAT | 83.01 | 71.26 | 81.88 | 83.49 | 82.47 | 93.29 |
| GAT+Align | 92.12 | 85.52 | 83.94 | 85.01 | 97.28 | 98.83 |
| GAT+Align+Pro | 93.44 | 87.50 | 85.01 | 85.50 | 97.52 | 98.94 |
| SAGE | 85.44 | 77.10 | 80.17 | 82.06 | 92.17 | 96.95 |
| SAGE+Align | 91.20 | 94.69 | 81.14 | 82.33 | 97.93 | 99.08 |
| SAGE+Align+Pro | 91.99 | 85.10 | 81.99 | 82.95 | 98.29 | 95.25 |
mation about nodes with different distributions, among nodes with similar distributions. This makes aggregation more effective and significantly enhances OOD detection capability.
❺ The joint alignment regularization plays a crucial role in EPGNN. EPGNN performs better than methods that solely employ CE loss. Because the joint alignment regularization coordinates the relationship between energy scores and output entropy, it guides the model to focus on key information that can distinguish ID and OOD samples. This process helps the gradient descent procedure more accurately locate the parameter space that is close to the actual solution.
Ablation Studies
Our method comprises two key modules: structure-aware energy propagation and joint alignment regularization. To answer research question Q2 and explore each module's contribution to EPGNN's overall performance, we conduct a detailed ablation study. Specifically, we evaluate the model's AUROC and AUPR by adding each module incrementally. Results are shown in Figure 3. Then, to explore the effectiveness of our plug-and-play modules across different backbones, we replace EPGNN's graph representation learning backbone with GCN, GAT, and GraphSAGE. The results are shown in Table 3. We draw the following observations:
❶ Joint alignment regularization is instrumental in capturing generalizable knowledge. Adding joint alignment regularization to the detection method using only cross-entropy loss increases average AUROC by 9.05% and AUPR by 10.94%, showing significant improvement in OOD detection. The reason is that the alignment of energy scores with output entropy fosters a deeper understanding of the differences between samples from different distributions, effectively enhancing the model's ability to identify OOD samples.
❷ Energy propagation module enhancing the OOD detection capability. When the model is further added to the structure-aware energy propagation module, there is an average improvement of 1.13% in AUROC and 1.45% in AUPR. The energy propagation module facilitates information exchange among nodes of the same distribution while blocking communication between nodes of different distributions, thereby widening the energy gap between OOD and ID nodes and improving the ability of OOD detection.
Hyperparameter Studies
To answer research question Q3, we investigate the impact of hyperparameters on experimental results. The hyperparameter β is the balance parameter for the joint alignment regularization, controlling the weight distribution between the crossentropy loss and the joint alignment regularization term. The hyperparameter T is the temperature parameter used to control the smoothness of energy scores. We use AUROC as the metric and conduct experiments with different hyperparameter values to determine their impact on EPGNN's performance. The performance results are shown in Figure 4. We draw the following observations:
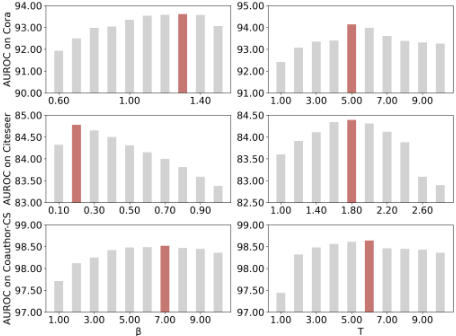
❶ For Cora, Citeseer, and Coauthor-CS datasets, EPGNN achieves optimal performance with β values of 1.25, 0.4, and 1.0, respectively. We found that the influence of β show an inverted U-shaped pattern. As β increases, the OOD detection performance initially improves, reaches a peak, and then starts to decline. This is because the balance between the cross-entropy loss and the joint alignment regularization term is achieved effectively at the optimal β, but when β deviates, the balance is disrupted, resulting in suboptimal performance.
❷ For Cora, Citeseer, and Coauthor-CS datasets, EPGNN achieves optimal performance with T values of 1.00, 1.75, and 2.00, respectively. The hyperparameter T also has an optimal value that makes the model perform optimally. When T is at the optimal value, the sharpness of the energy scores is most appropriate. A low T makes scores too sharp, causing the model to overfit the training data and poor performance on unseen data. Conversely, a high T makes energy scores overly smooth, leading to a lack of discrimination between ID and OOD samples, thus affecting the OOD detection ability.
6 Conclusion
We introduce EPGNN, a novel framework for OOD detection in graph. Specifically, we design an energy-based OOD evaluator to distinguish ID and OOD nodes. Furthermore, we introduce a structure-aware energy propagation module to achieve effective energy aggregation. Additionally, we propose a joint alignment regularization to guide the learning process of EPGNN. Extensive experiments demonstrate that EPGNN outperforms existing methods in OOD node detection and ID node classification.
Acknowledgments
This work is supported in part by the National Natural Science Foundation of China (No. 62272191, No. 62372211), and the International Science and Technology Cooperation Program of Jilin Province (No. 20240402067GH).
Contribution Statement
Yunxia Zhang and Mingchen Sun contribute equally to this work.
@inproceedings{ijcai2025p786,
  title     = {Graph OOD Detection via Plug-and-Play Energy-based Evaluation and Propagation},
  author    = {Zhang, Yunxia and Sun, Mingchen and Zhang, Yutong and Yang, Funing and Wang, Ying},
  booktitle = {Proceedings of the Thirty-Fourth International Joint Conference on
               Artificial Intelligence, {IJCAI-25}},
  publisher = {International Joint Conferences on Artificial Intelligence Organization},
  editor    = {James Kwok},
  pages     = {7065--7073},
  year      = {2025},
  month     = {8},
  note      = {Main Track},
  doi       = {10.24963/ijcai.2025/786},
  url       = {https://doi.org/10.24963/ijcai.2025/786},
}
TY - CPAPER TI - Graph OOD Detection via Plug-and-Play Energy-based Evaluation and Propagation AU - Zhang, Yunxia AU - Sun, Mingchen AU - Zhang, Yutong AU - Yang, Funing AU - Wang, Ying T2 - Proceedings of the Thirty-Fourth International Joint Conference on Artificial Intelligence, IJCAI-25 PB - International Joint Conferences on Artificial Intelligence Organization PY - 2025 SP - 7065 EP - 7073 DO - 10.24963/ijcai.2025/786 UR - https://doi.org/10.24963/ijcai.2025/786 ER -Copied
Machine-readable versions of this paper, for tools and AI agents:





