
Underground Diagnosis in 3D GPR Data by Learning in CuCoRes Model Space
Proceedings of the Thirty-Fourth International Joint Conference on Artificial Intelligence. Main Track. Pages 7200-7208.
https://doi.org/10.24963/ijcai.2025/801
Keywords
- Machine Learning: ML: Applications
- Machine Learning: ML: Recurrent networks
- Machine Learning: ML: Clustering
Abstract
Ground Penetrating Radar (GPR) provides detailed subterranean insights. Nevertheless, underground diagnosis via GPR is hindered by the fact that training data typically contain only normal samples, along with the complexity of GPR data’s wave-collection characteristics. This paper proposes subsurface anomaly detection within the Cubic Correlation Reservoir Network (CuCoRes) model space. CuCoRes incorporates three reservoirs with spatial correlation adjustment in each direction to adequately and accurately capture multi-directional dynamics (i.e., changing information) within GPR data. Fitting GPR data with CuCoRes and representing data with fitted models, the original GPR data is mapped into a category-discriminative CuCoRes model space, where anomalies could be efficiently identified and categorized based on model dissimilarities. Our approach leverages only limited normal GPR data, easily accessible, to support subsequent anomaly detection and categorization, enhancing its applicability in practical scenarios. Experiments on real-world data demonstrate its effectiveness, outperforming state-of-the-art.
- [Ackermann et al., 2014] Marcel R Ackermann, Johannes Blömer, Daniel Kuntze, and Christian Sohler. Analysis of agglomerative clustering. Algorithmica, 69:184-215, 2014.
- [Astrid et al., 2021] Marcella Astrid, Muhammad Zaigham Zaheer, and Seung-Ik Lee. Synthetic temporal anomaly guided end-to-end video anomaly detection. In Proceed- ings of the IEEE/CVF International Conference on Com- puter Vision (ICCV) Workshops, pages 207-214, October 2021.
- [Bezdek et al., 1984] James C Bezdek, Robert Ehrlich, and William Full. FCM: The fuzzy c-means clustering algo- rithm. Computers & geosciences, 10(2-3):191-203, 1984.
- [Bianchi et al., 2020] Filippo Maria Bianchi, Simone Scar- dapane, Sigurd Løkse, and Robert Jenssen. Reservoir computing approaches for representation and classification of multivariate time series. IEEE transactions on neural networks and learning systems, 32(5):2169-2179, 2020.
- [Brock et al., 2016] Andrew Brock, Theodore Lim, James M Ritchie, and Nick Weston. Generative and discriminative voxel modeling with convolutional neural networks. arXiv preprint arXiv:1608.04236, 2016.
- [Carreira and Zisserman, 2017] Joao Carreira and Andrew Zisserman. Quo vadis, action recognition? a new model and the kinetics dataset. In Proceedings of the IEEE Conference on Computer Vision and Pattern Recognition, pages 6299-6308, 2017.
- [Chen et al., 2013] Huanhuan Chen, Peter Tiňo, Ali Rodan, and Xin Yao. Learning in the model space for cognitive fault diagnosis. IEEE transactions on neural networks and learning systems, 25(1):124-136, 2013.
- [Chen et al., 2014] Huanhuan Chen, Peter Tiňo, and Xin Yao. Cognitive fault diagnosis in tennessee eastman pro- cess using learning in the model space. Computers & chemical engineering, 67:33-42, 2014.
- [Chen et al., 2024] Ao Chen, Xiren Zhou, Yizhan Fan, and Huanhuan Chen. Underground diagnosis based on gpr and learning in the model space. IEEE Transactions on Pat- tern Analysis and Machine Intelligence, 46(5):3832-3844, 2024.
- [Chiu and Minku, 2022] Chun Wai Chiu and Leandro L. Minku. A diversity framework for dealing with multiple types of concept drift based on clustering in the model space. IEEE Transactions on Neural Networks and Learn- ing Systems, 33(3):1299-1309, 2022.
- [Frolova et al., 2023] Daria Frolova, Aleksandr Katrutsa, and Ivan Oseledets. Feature-based pipeline for improv- ing unsupervised anomaly segmentation on medical im- ages. In Carole H. Sudre, Christian F. Baumgartner, Adrian Dalca, Raghav Mehta, Chen Qin, and William M. Wells, editors, Uncertainty for Safe Utilization of Machine Learning in Medical Imaging, pages 115-125, Cham, 2023. Springer Nature Switzerland. Gong et al., 2018] Zhichen Gong, Huanhuan Chen, Bo Yuan, and Xin Yao. Multiobjective learning in the model space for time series classification. IEEE transactions on cybernetics, 49(3):918-932, 2018.
- [Gong et al., 2019] Dong Gong, Lingqiao Liu, Vuong Le, Budhaditya Saha, Moussa Reda Mansour, Svetha Venkatesh, and Anton van den Hengel. Memorizing nor- mality to detect anomaly: Memory-augmented deep au- toencoder for unsupervised anomaly detection. In Pro- ceedings of the IEEE/CVF International Conference on Computer Vision (ICCV), October 2019.
- [Goodman et al., 2013] Dean Goodman, Salvatore Piro, Dean Goodman, and Salvatore Piro. Multi-channel gpr. GPR Remote Sensing in Archaeology, pages 175-185, 2013.
- [Hara et al., 2017] Kensho Hara, Hirokatsu Kataoka, and Yutaka Satoh. Learning spatio-temporal features with 3d residual networks for action recognition. In Proceedings of the IEEE International Conference on Computer Vision Workshops, pages 3154-3160, 2017.
- [Hartigan and Wong, 1979] John A Hartigan and Manchek A Wong. Algorithm as 136: A k-means clustering algorithm. Journal of the royal statistical society. series c (applied statistics), 28(1):100-108, 1979.
- [Hou et al., 2024] Feifei Hou, Boxuan Qiao, Jian Dong, and Zhijie Ma. S-cyclegan: A novel target signature segmen- tation method for gpr image interpretation. IEEE Geo- science and Remote Sensing Letters, 21:1-5, 2024.
- [Jaeger, 2001] Herbert Jaeger. The "echo state" approach to analysing and training recurrent neural networks-with an erratum note. Bonn, Germany: German National Re- search Center for Information Technology GMD Technical Report, 148(34):13, 2001.
- [Kang et al., 2019] Man-Sung Kang, Namgyu Kim, Seok Been Im, Jong-Jae Lee, and Yun-Kyu An. 3d gpr image-based ucnet for enhancing underground cavity detectability. Remote Sensing, 11(21), 2019.
- [Liang et al., 2022a] Xingmin Liang, Xin Yu, Chen Chen, Yong Jin, and Jiandong Huang. Automatic classification of pavement distress using 3d ground-penetrating radar and deep convolutional neural network. IEEE Transactions on Intelligent Transportation Systems, 23(11):22269-22277, 2022.
- [Liang et al., 2022b] Xingmin Liang, Xin Yu, Chen Chen, Yong Jin, and Jiandong Huang. Automatic classification of pavement distress using 3d ground-penetrating radar and deep convolutional neural network. IEEE Transactions on Intelligent Transportation Systems, 23(11):22269-22277, 2022.
- [Liu et al., 2022] Li Liu, Hang Yu, Hang Xu, Bingjie Wang, and Jingxia Li. Underground object classification using deep 3-d convolutional networks and multiple mirror en- coding for gpr data. IEEE Geoscience and Remote Sensing Letters, 19:1-5, 2022.
- [Liu et al., 2023] Zhikang Liu, Yiming Zhou, Yuansheng Xu, and Zilei Wang. Simplenet: A simple network for image anomaly detection and localization. In Proceedings of the IEEE/CVF Conference on Computer Vision and Pat- tern Recognition (CVPR), pages 20402-20411, June 2023.
- [Liu et al., 2024] Shikang Liu, Xiren Zhou, and Huanhuan Chen. From data to d3 model: Adaptive subsurface anomaly detection in gpr data. IEEE Transactions on Geo- science and Remote Sensing, 2024.
- [Lukoševičius and Jaeger, 2009] Mantas Lukoševičius and Herbert Jaeger. Reservoir computing approaches to recur- rent neural network training. Computer science review, 3(3):127-149, 2009.
- [Quevedo et al., 2014] Joseba Quevedo, Huanhuan Chen, Miquel À Cugueró, Peter Tino, Vicenc ¸Puig, Diego Garciá, Ramon Sarrate, and Xin Yao. Combining learning in model space fault diagnosis with data validation/recon- struction: Application to the barcelona water network. En- gineering Applications of Artificial Intelligence, 30:18-29, 2014.
- [Schlegl et al., 2019] Thomas Schlegl, Philipp Seeböck, Se- bastian M. Waldstein, Georg Langs, and Ursula Schmidt- Erfurth. f-anogan: Fast unsupervised anomaly detec- tion with generative adversarial networks. Medical Image Analysis, 54:30-44, 2019.
- [Tran et al., 2015] Du Tran, Lubomir Bourdev, Rob Fergus, Lorenzo Torresani, and Manohar Paluri. Learning spa- tiotemporal features with 3d convolutional networks. In Proceedings of the IEEE International Conference on Computer Vision, pages 4489-4497, 2015.
- [Tran et al., 2018] Du Tran, Heng Wang, Lorenzo Torresani, Jamie Ray, Yann LeCun, and Manohar Paluri. A closer look at spatiotemporal convolutions for action recognition. In Proceedings of the IEEE Conference on Computer Vi- sion and Pattern Recognition, pages 6450-6459, 2018.
- [Van der Maaten and Hinton, 2008] Laurens Van der Maaten and Geoffrey Hinton. Visualizing data using t-sne. Journal of machine learning research, 9(11), 2008.
- [Wu et al., 2022] Jiamin Wu, Xiren Zhou, and Qiuju Chen. A characteristic of speaker's audio in the model space based on adaptive frequency scaling. In 2022 8th Interna- tional Conference on Big Data and Information Analytics (BigDIA), pages 99-103. IEEE, 2022.
- [Yan et al., 2024] Min Yan, Can Huang, Peter Bienstman, Peter Tino, Wei Lin, and Jie Sun. Emerging opportuni- ties and challenges for the future of reservoir computing. Nature Communications, 15(1):2056, 2024.
- [Zhou et al., 2018] Xiren Zhou, Huanhuan Chen, and Jin- long Li. An automatic GPR b-scan image interpreting model. IEEE Transactions on Geoscience and Remote Sensing, 56(6):3398-3412, 2018.
- [Zhou et al., 2023] Xiren Zhou, Shikang Liu, Ao Chen, Qi- uju Chen, Fang Xiong, Yumin Wang, and Huanhuan Chen. Underground anomaly detection in GPR data by learning in the c3 model space. IEEE Transactions on Geoscience and Remote Sensing, pages 1-11, 2023.
- [Zhou et al., 2024] Xiren Zhou, Shikang Liu, Ao Chen, and Huanhuan Chen. Learning in cuberes model space for anomaly detection in 3d gpr data. In Kate Larson, editor, Proceedings of the Thirty-Third International Joint Con- ference on Artificial Intelligence (IJCAI-24), pages 5662- 5670. International Joint Conferences on Artificial Intelli- gence Organization, 2024. IJCAI
References were extracted automatically from the PDF and may contain errors.
Full text extracted automatically from the PDF; figures, tables and equations may differ. The PDF is the version of record.
1 Introduction
Subsurface conditions could be effectively detected and imaged using Ground Penetrating Radar (GPR), a geophysical technique that transmits high-frequency electromagnetic (EM) waves and analyzes their reflections [Zhou et al., 2018]. Compared to single-channel systems, multi-channel GPR provides richer and more detailed underground information but also produces large and complex three-dimensional (3D) GPR data 1 [Goodman et al., 2013].
Underground diagnosis via GPR typically involves segmenting the collected GPR data along the detection direction and further identifying sections with subterranean diseases such as cracks, cavities, or looseness, a labor-intensive and time-consuming process when manually performed. While image and signal-based algorithms aid in categorizing GPR
∗Corresponding author: Huanhuan Chen.
1 "GPR data" in this paper refers to 3D GPR data by default.
data, they struggle with variability in anomaly characteristics such as composition, size, and environment. Advancements in Deep Learning (DL) approaches, particularly Convolutional Neural Networks (CNNs), have also been applied to object and anomaly detection in GPR data [Liang et al., 2022a; Hou et al., 2024]. Despite their potential, DL methods face considerations. The limited data availability, particularly in a targeted detection area, often leads to restricted training datasets primarily composed of only normal GPR data samples free from subsurface targets. The variability of underground environments also undermines the generalization of DL approaches, restricting their adaptability to various or unfamiliar subsurface conditions. These highlight the challenge of detecting and categorizing subsurface anomalies in unseen environments using only newly collected normal data.
Given the above considerations, the Learning in the Model Space (LMS) framework offers a viable alternative [Chen et al., 2013]. LMS transitions data from data space to model space by fitting the data with appropriate models that capture and describe the dynamics (i.e., changing information) within the data. Consequently, the fitted models serve as more stable and parsimonious representations of the data, enabling learning algorithms to be implemented on the fitted models rather than the original data. Successfully applied to diagnosing the Barcelona water network [Quevedo et al., 2014] and the Tennessee Eastman Process [Chen et al., 2014], along with diverse time-series classification tasks [Gong et al., 2018; Wu et al., 2022], LMS has proven its efficacy in various tasks using the Echo State Network (a type of reservoir computing network) for data fitting and representation. Notably, LMS focuses on the data-intrinsic dynamics, which allows for reduced reliance on training data and diminishes the computational demands compared to many DL methodologies, particularly with adequate and accurate dynamic capture.
While efforts have been made to apply LMS in GPR data processing, considerations remain. LMS typically captures uni-directional dynamics, designed primarily for sequential data with contextual relationships. However, GPR data involves both vertical variations and horizontal correlations due to the continuity of the subsurface medium and EM waves. Although attempts have been made to adequately capture multi-directional dynamics in GPR data [Chen et al., 2024; Zhou et al., 2023], correlations in GPR data vary across spatial orientations due to differences in antenna channel spacing, sampling frequencies, and the underground medium's dielectric constant, with some directions being more strongly correlated. This variation requires precise capture and adjustment of dynamics within each direction. Despite recent advances [Zhou et al., 2024] to optimize this process using accurately labeled multi-type data, acquiring a sufficiently diverse training dataset often remains impractical.
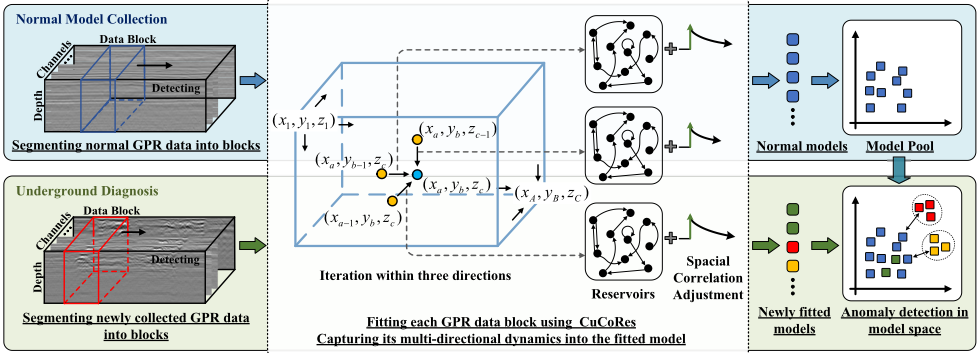
In response, this paper proposes learning in the Cubic Correlation Reservoir Network (CuCoRes) model space for underground diagnosis, as depicted in Figure 1. Our approach only requires limited normal GPR data, commonly available from the detection area, to support subsequent anomaly detection and categorization. We segment normal GPR data into data blocks, with each block being fitted by CuCoRes 2 . Given GPR data's vertical continuity along EM waves and horizontal correlations due to subsurface medium consistency, each point in GPR data is correlated with its surroundings in multiple directions. Different underground structures manifest different dynamics in GPR data. The proposed CuCoRes integrates three reservoirs in its hidden layer, and applies spatial correlation adjustment in each direction, constructing connections between points within the data across multiple directions, during which it adaptively strengthens the correlation with nearer points while weakening it with those further away. Fitting the data block with CuCoRes effectively captures the data-inherent multi-directional dynamics, resulting in a compact fitted readout model. Representing each block with the fitted model, coupled with the distance measurement between models, transitions the original GPR data blocks into the CuCoRes model space. These models, derived from normal data blocks, are collected into a "Model Pool".
For subsurface anomaly detection in subsequent GPR data, we continue with the same segmentation process and fit each data block with CuCoRes, deriving the fitted model for each block. Given the consistent dynamics within GPR data, blocks originating from identical subsurface structures derive similar CuCoRes models, whereas models fitted from diverse subsurface structures manifest significant variations, depicting the unique dynamics captured. Each newly fitted model is then evaluated against the established model pool, obtaining its anomaly score. Models registering higher anomaly scores, indicative of potential anomalies, are identified and categorized, allowing us to precisely identify the corresponding abnormal block and determine the type of anomaly associated with each identified GPR data block. The main contributions of this paper are as follows:
2 In this paper, "CuCoRes" designates the network used for data fitting, resulting in the "CuCoRes fitted readout model" for data representation, also simplified as "CuCoRes model" or "fitted model".
- Our approach focuses on the inherent dynamics present in GPR data, and leverages only limited normal GPR data, easily obtainable in the detection area, to support subsequent anomaly detection and categorization, enabling its practical usability in real-world settings.
- The introduced CuCoRes, incorporating three reservoirs with spatial correlation adjustments in each direction, builds multi-directional correlations among data points, enhancing connections with nearer points while reducing those with distant ones, thus adequately and accurately capturing multi-directional dynamics in GPR data.
- Representing data with fitted CuCoRes models, coupled with the directly computable distance measurement between models, allows further anomaly detection and categorization to be effectively performed within the category-discriminative CuCoRes model space.
2 RelatedWork
2.1 GPRData Analyzing
GPR data, specifically the multi-channel 3D GPR data, provides an advanced geophysical tool for viewing what lies beneath the surface. As Figure 2 shows, single-channel GPR provides 2-dimensional (2D) data. Multi-channel GPR systems consist of antenna arrays, with each channel simultaneously transmitting and receiving EM waves, offering a comprehensive 3D subsurface visualization.
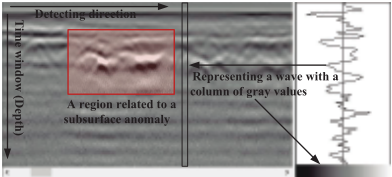
GPR data collects and arranges EM waves, with each point indicating wave intensity at a specific subsurface location. Due to the continuity of underground media and the presence of anomalies, GPR data exhibits valuable dynamics, that is, changing information vertically and horizontally along and among waves. Moreover, directional scales vary, leading to different correlations between adjacent points in various directions. For example, the distance between adjacent channels is about 15 cm, the gap between rows within a channel ranges from 2 to 6 cm, and the spacing between points within a row, influenced by the dielectric constant, is 2 to 5 cm. Accurately capturing data-inherent dynamics requires accounting for multiple directions and directional scale differences.
Recent DL advancements in 3D GPR data analysis follow two main strategies: 1) Direct 3D processing, such as Multiple Mirror Encoding (MME) [Liu et al., 2022] with C3D network [Tran et al., 2015] for spatio-temporal feature extraction, and 3DInvNet, which uses a 3D CNN with feature attention and a U-shaped encoder-decoder for multiscale feature aggregation; 2) Integrating 2D processing results for 3D data, such as UcNet [Kang et al., 2019], combining CNNs with phase analysis to enhance resolution, and [Liang et al., 2022b], comparing VGG and ResNet for classifying anomaly-associated GPR data. Nevertheless, existing DL approaches designed for 3D GPR data require multi-type labeled data for training or optimization, and fail to be performed with only limited labeled data support.
2.2 Learning in the Model Space(LMS)
The LMS framewor 3 , first introduced in [Chen et al., 2013], was initially applied to fault diagnosis in sequential data. LMS typically employs ESN to fit individual data instances, transitioning them into a model space represented by their respective fitted models. This transformation allows learning algorithms to operate effectively within the model space, leveraging the dynamics captured from the data. Over time, LMS has been adapted for various applications, including time series classification, disease diagnosis [Bianchi et al., 2020], and addressing concept drift [Chiu and Minku, 2022].
3 Also denoted as "Model-Space Learning".
Existing studies [Zhou et al., 2023; Chen et al., 2024] have investigated classifying 2D GPR data using an enhanced ESN-based network, which captures horizontal and vertical dynamics into fitted models. For 3D GPR data, characterized by higher dimensions and more complex intrinsic dynamics, a common approach is to apply LMS independently to each channel as 2D data and then aggregate the results [Liu et al., 2024]. However, this approach neglects inter-channel dynamics. To address this, Zhou et al. [2024] proposed CubeRes, augmenting the ESN's hidden layer with multiple reservoirs to better capture multi-directional dynamics within 3D data. Despite this, CubeRes does not a priori account for spatial scale variations across different directions in GPR data. Additionally, while this study suggested using labeled data to optimize fitting accuracy and model classification, the lack of sufficient, diverse, and accurately labeled GPR data in specific detection areas limits its practical applicability.
2.3 Echo State Network (ESN): ARepresentative Reservoir Computing Network
ESN, a subset of reservoir computing and recurrent neural networks, is renowned for its simplicity and efficiency in processing sequential data [Lukoˇseviˇcius and Jaeger, 2009]. ESN features fixed, randomized input weights and a reservoir of randomly connected neurons (Figure 3). This reservoir processes historical data by transforming it into highdimensional states, known as "echo states", effectively capturing complex, data-inherent dynamics [Yan et al., 2024].
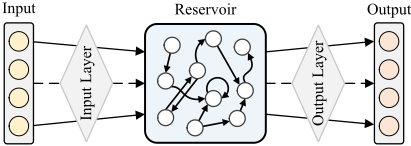
For sequential data fitting, ESN computes a hidden state for each point in the input sequence, and the output layer maps it to the target sequence solved via regression.
3 Methodology
As illustrated in Figure 1, our approach consists of two stages:
- Normal Model Collection: Normal GPR data, free from subsurface anomaly and readily available in the detection area, is segmented along the detecting direction into same-size blocks, each independently fitted by CuCoRes to capture its multi-directional dynamics. The resulting fitted models, representing their respective data blocks, are collected into a "Model Pool".
- Underground Diagnosis: Newly collected GPR data undergoes the same segmentation and CuCoRes fitting,
obtaining fitted models. These models are compared to those in the model pool, with abnormal models identified and clustered based on model dissimilarities, enabling the detection and categorization of corresponding anomaly-associated GPR data blocks.
In our approach, fitting GPR data and capturing its multidirectional dynamics via CuCoRes are crucial for data representation and subsequent anomaly detection on fitted models. Therefore, we start with a comprehensive introduction to CuCoRes, followed by descriptions of the two stages.
3.1 Data Fitting and Representation via CuCoRes
CuCoRes consists of an input layer, a hidden layer, and an output layer. Notably, to accurately capture multi-directional dynamics within 3D GPR data, CuCoRes enhances the hidden layer with three reservoirs, each implementing spatial correlation adjustment, thus effectively building correlations among points in various directions.
Fitting GPR Data by CuCoRes
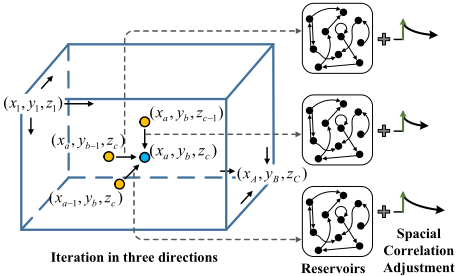
Denoting a GPR data block as U ∈ RA×B×C , wherein a data point within this block is localized by (xa, yb, zc), and the corresponding value at that point is u(xa, yb, zc). The iteration of CuCoRes begins at the point (x1, y1, z1) and ends at (xA, yB, zC). Sequentially, as shown in Figure 4, each point is sent into the hidden layer, with their hidden states h ∈ RN×1 calculated as:
where:
- a, b, c ∈ Z are the indices of the point (xa, yb, zc) in the x-, y-, and z-directions, respectively. g is the activation function tanh. Win ∈ RN×1 denotes the input weights.
- W ∈ RN×3N are reservoir weights for each direction:
where Wx ,Wy ,Wz ∈ RN×N represent the reservoir weights along the x-, y-, and z-direction, respectively.
- E ∈ R3N×3N represents exponential spatial correlation adjustments applied to each direction:
where I ∈ RN×N is the identity matrix, (xa - xa-1), (yb - yb-1), and (zc - zc-1) refer to the distances between a point and its adjacent points in the x-, y-, and z- direction, respectively. Introducing E assigns greater importance to nearby points and reduces the influence of distant points, adaptively emphasizing local spatial relationships for more accurate dynamic capture.
- h∗ ∈ R3N×1 is the concatenation of the previous hidden states from the three directions:
In CuCoRes, Θ = (Win ,Wx ,Wy ,Wz ) are randomly initialized and fixed. The input weight Win is uniformly distributed in [-1, 1]. Wx ,Wy ,Wz are randomly determined reservoir weights that describe neuron connections in the reservoir, fulfilling the Echo State Property [Jaeger, 2001], with a spectral radius within (0, 1). The initial hidden states: h(x0, ·, ·) = h(·, y0, ·) = h(·, ·, z0) = 0.
During hidden-state iteration, each hidden state integrates current and past information, inducing directional correlations among neighboring points. The correlation adjustment E modulates these correlations by strengthening connections between nearby points and weakening those between distant ones. Unlike existing LMS methods, 2D-ESN [Chen et al., 2024] and C3 [Zhou et al., 2023], which manually adjust directional associations, or CubeRes [Zhou et al., 2024], which learns them from labeled data, our approach adapts to varying directional scales in GPR data. Evolving multi-directional correlations form a network that links each point to processed ones, accurately capturing multi-directional dynamics.
After computing the hidden states for all data points within the data block, the output value v for each point is calculated from the previous hidden states:
whereWout ∈ R1×3N is the output weight, β is the bias.
The fitting process is accomplished using the "next point prediction" task [Chen et al., 2013]. It aims to predict the value of the subsequent point based on processed ones, establishing a mapping between hidden states and corresponding input data points. Explicitly, each output value v(xa, yb, zc), derived from the hidden states, is required to closely match the input u(xa, yb, zc). To achieve this, the output weights Wout and the bias β are determined using ridge regression:
where ˜H is augmented from the hidden state matrix H, extended by a row of ones for bias terms; H ∈ R3N×ABC is obtained by collecting the previous hidden states of all data points in sequence and column-wise, with each column representing a specific h∗ (x, y, z); u ∈ RABC×1 is a vectorized form of the input values u(x, y, z), arranged in the same order as h∗ (x, y, z) in H; I ∈ R3N×3N is the identity matrix; and λ serves as a regularization.
During CuCoRes' fitting process, the three-reservoir architecture, spatial correlation adjustments, and the unique hidden-state iteration of CuCoRes adeptly establish the correlation between adjacent points in the data block, capturing data-intrinsic changing information. The fitting approach integrates multi-directional dynamics within the data block into a compact fitted CuCoRes readout model:
This readout model provides a compact representation of the original data block. When an anomaly arises in a data block, it introduces atypical dynamics, causing the readout model to exhibit distinct characteristics compared to those derived from normal GPR data blocks. As a result, representing the data blocks by readout models enhances category discrimination, which in turn improves the effectiveness of model classification compared to using the original data blocks.
Distance Measurement between Fitted Models
After data fitting via CuCoRes, it is essential to establish a distance measurement to quantify the differences between the fitted models, aiding subsequent anomaly detection on the models. The p-norm distance [Chen et al., 2013] between models f1(x) and f2(x) is adopted:
Here, f1 and f2 represent the simplified forms of f1(x) and f2(x), respectively; µ(x) denotes the probability density over the input domain, and the integral range C is [-1, 1]3N . For the sake of simplicity, p is set to 2 by default, and we assume x follows a uniform distribution.
Given the two blocks fitted using CuCoRes, the models derived for each are denoted as follows:
Substituting Equation (8) into Equation (7) results in:
Such direct-measured pair-wise distance measurement specified in Equation (9) facilitates the usage of distance-based learning algorithms on the fitted models.
3.2 Normal Model Collection
Given normal 3D GPR data gathered from the detection area, we first segment them into same-size data blocks along the detection direction 4 . Each block is individually fitted by CuCoRes, resulting in a respective readout model. The models obtained from these normal blocks are collected into a
4 Performed using a sliding window that moves along the detection direction, as described in [Zhou et al., 2024; Liu et al., 2024].
"Model Pool". This process is described as:
where M denotes the model pool, R is the collection of normal GPR data samples; ri denotes a data sample in R; S represents the segmentation process; U is a specific data blocks; and F refers to CuCoRes fitting process.
3.3 Underground Diagnosis
Anomaly detection on the newly collected GPR data is performed through the following three steps: 1) Fitting Data Blocks via CuCoRes: Apply the same segmentation and fitting procedures as described earlier, obtaining the fitted CuCoRes model for each data block; 2) Model Discrimination: For each model, find the nearest normal model in the model pool through the model distance measurement given in Equation (9), examining its anomaly score, with overly high scores identified to be anomalies; 3) Model Categorization: Cluster the abnormal models identified in the previous step, where each cluster signifies a type of anomaly.
The first step has been previously described and is the same as the training stage, thus would not be repeated here. Details for the subsequent steps are provided as follows.
Distance-based Model Discrimination
For anomaly detection in newly collected GPR data, segmentation and CuCoRes fitting derive a set of fitted models (each corresponding to a data block). Each model undergoes a Nearest-Neighbor (NN) search in the model pool to estimate an anomaly score, determining its abnormality.
The existence of an underground anomaly introduces distinct dynamics that differ significantly from normal GPR data. Consequently, models fitted from such blocks deviate noticeably from those fitted from normal data, due to the distinct dynamics captured. Specifically, models derived from normal data tend to cluster tightly, while those derived from anomalies are distinctly separated from the normal ones, and positioned far from normal models. To assess the anomaly score for a newly fitted model f, the distance to its nearest neighbor model in the model pool M is computed, and the anomaly score is defined as:
where f is a newlly fitted model, f ∗ denotes one of the normal models in model pool M, and D2 is the distance measurement between models defined in Equation (9).
A binary classifier H is then employed to discriminate normal (denoted as 1) and abnormal (denoted as 0) models:
where f represents the model under evaluation, score is given in Equation (11), and τ is a predefined threshold.
Model Categorization
Through the above steps, models fitted from anomaly data blocks are identified. Different underground anomalies introduce unique dynamics in GPR data due to distinct changing information along and among the collected EM waves. As a result, models from different anomaly types differ significantly, while those from the same anomaly type are similar due to consistent inherent dynamics. This forms a categorydiscriminative CuCoRes model space, where clustering approaches 5 could be performed to categorize models, with each cluster representing a specific anomaly type.
4 Experimental Study
All experiments are conducted using Python 3.6 on a desktop with an Intel Core i5-11500 2.70-GHz CPU, 16-GB RAM, and a GeForce RTX 3080Ti 12G graphics card. For the implementation of our approach, we initialize the input weights and reservoir weights of CuCoRes randomly following a standard normal distribution. The size of each reservoir is default set as 50, the spectral radii are set to 0.9. The anomaly score threshold τ is defined as the maximum of the minimum distances between any normal models. As for the clusters, we use the official implementation from https://scikit-learn.org/.
4.1 The Utilized 3DGPR data
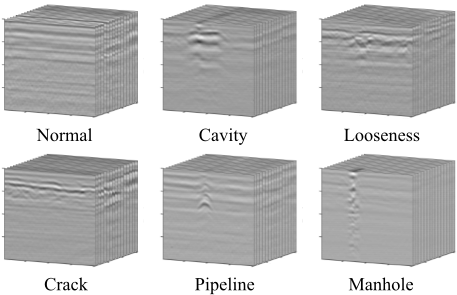
GPR data is collected from cement and asphalt roads using a 3D GPR system with a 16-channel antenna. The data is segmented into 16×200×200 blocks, representing a physical area of approximately 2.5m (width) × 4m (detecting direction) × 4m (depth). Each block, except for normal ones, contains an anomaly. The number of blocks per type is shown in Table 1. Three main types of subsurface anomalies are identified: cavities, looseness, and cracks. The GPR data also includes pipelines and manhole covers, also crucial to detect. Examples of GPR data blocks are shown in Figure 5.
| Normal | Cavity | Looseness | Crack | Pipeline | Manhole |
|---|---|---|---|---|---|
| 200 | 192 | 203 | 191 | 201 | 192 |
4.2 Anomaly Detection of GPRData
For underground diagnosis, the initial focus involves identifying anomalies in newly collected GPR data using only previously acquired normal data free from subsurface anomalies or other objects. We randomly select 100 normal data blocks for initialization. For testing, the remaining 100 normal blocks and 20 blocks from each anomaly type are used.
To our knowledge, apart from supervised methods requiring multi-type labeled GPR data (discussed in Section 2), no existing research tailored for 3D GPR data performs anomaly detection on new data given only limited normal data support. We evaluate our approach against recent baselines that, while not specifically designed for GPR data, are able to utilize solely normal GPR data for anomaly detection in newly collected data, including: 1) Voxel-based anomaly detection methods, which treats 3D DPR data as a three-dimensional matrix: Patchcore-3D [Frolova et al., 2023], Synthetic Temporal Anomaly Guided End-to-End Video Anomaly Detection (STEAL) [Astrid et al., 2021], 3D-VAE [Brock et al., 2016], MemAE [Gong et al., 2019], and Cube Reservoir Computing without optimization (CubeRes w/o) since only normal data is provided [Zhou et al., 2024]; 2) Image-based anomaly detection approaches, in which 3D DPR data is considered as a multi-channel image: f-AnoGAN [Schlegl et al., 2019], and SimpleNet [Liu et al., 2023];
5 Clustering techniques such as K-Means [Hartigan and Wong, 1979], Agglomerative Clustering [Ackermann et al., 2014], or Fuzzy C-Means [Bezdek et al., 1984] could be applied, support with the introduced model distance measurement.
| Methods | Precision(Pre) | Recall(Rec) | F1-Score |
|---|---|---|---|
| Patchcore-3D | 83.2%± 2.5% | 86.0%± 2.1% | 84.6%± 1.8% |
| STEAL | 84.8%± 1.6% | 82.7%± 2.4% | 83.7%± 2.0% |
| 3D-VAE | 86.0%± 2.3% | 84.6%± 1.1% | 85.3%± 1.7% |
| MemAE | 79.2%± 2.1% | 81.6%± 2.8% | 80.4%± 1.4% |
| f-AnoGAN | 81.6%± 1.0% | 79.8%± 2.6% | 80.7%± 2.2% |
| SimpleNet | 80.9%± 1.4% | 79.3%± 2.3% | 79.6%± 1.2% |
| CubeRes (w/o) | 87.9%± 1.9% | 87.3%± 2.5% | 87.6%± 2.0% |
| CuCoRes (ED.) | 90.1%± 2.6% | 89.2%± 1.8% | 89.7%± 2.0% |
| Our Approach | 92.2%± 1.8% | 91.7%± 1.2% | 91.9%± 1.4% |
The results 6 are presented in Table 2. Voxel-based methods like Patchcore-3D, STEAL, etc, treat 3D GPR data as three-dimensional matrices, but struggle with the given insufficient normal data for effective optimization, failing to distinguish variations among normal and abnormal patterns in GPR data. Image-based methods, such as f-AnoGAN and SimpleNet, designed for 2D image format, overlook effective changing information of a certain dimension and fail to adequately capture the internal dynamics in 3D GPR data. Building correlations along and among EM waves, fitting GPR data via CuCoRes adequately and accurately capturing the data-inherent multi-directional dynamics. Consequently, CuCoRes models fitted from anomaly blocks, markedly differ from those derived from normal. Focusing on the datainherent changing information, our approach demonstrates superior anomaly detection performance compared to baselines, even with the given minimal normal data support.
6 CuCoRes (ED.) refers to the result obtained by using the Euclidean distance to measure the difference between CuCoRes models, subsequently discussed in Subsection 4.4: Ablation Study.
4.3 The Model/Feature Clustering Results
After identifying abnormal models, our approach employs clustering to categorize these models, grouping data blocks originating from the same type of anomalies. The introduced CuCoRes fits and captures the multi-directional dynamics within the GPR data without offline iterative training. The fitted models serve as representations of the original blocks.
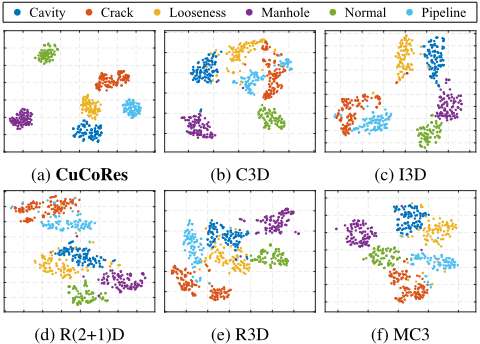
We adopt feature extractors including, 3D ResNet (R3D) [Hara et al., 2017], 3D Convolutional Neural Networks (C3D) [Tran et al., 2015], (2+1)D Convolutional Networks (R(2+1)D) [Tran et al., 2018], Mixed Convolutions 3D and 2D (MC3) and Inflated 3D ConvNet (I3D) [Carreira and Zisserman, 2017] on the identified abnormal blocks 7 . We also utilized CubeRes (w/o) [Zhou et al., 2024] for data fitting and representation. These features/models are clustered by three widely used clustering algorithms: K-Means, Agglomerative clustering (AC), and Fuzzy C-Means (FCM).
Table 3 shows that CuCoRes surpasses other methods in anomaly clustering. Using t-SNE [Van der Maaten and Hinton, 2008], we visualized the fitted models and other features in 2D space (Figure 6), where each point represents a fitted model or feature associated with a GPR data block. Although GPR data appears image-like, it fundamentally represents EM wave collections with unique dynamics arising from variations along and among the waves caused by different underground anomalies. Pre-trained deep neural networks, primarily designed for visual feature extraction, struggle to capture and distinguish these dynamics effectively. CuCoRes, focusing on data-inherent changing information, captures multi-directional dynamics by establishing correlationadjusted connections within the data block across multiple directions. Owing to the distinct dynamics captured, the models derived from CuCoRes exhibit superior clustering performance on different types of subsurface anomalies.
7 Pre-trained on Kinetics dataset [Carreira and Zisserman, 2017].
| Methods | K-Means | AC | FCM | ||||||
|---|---|---|---|---|---|---|---|---|---|
| Acc | ARI | NMI | Acc | ARI | NMI | Acc | ARI | NMI | |
| C3D | 0.57 | 0.36 | 0.55 | 0.69 | 0.57 | 0.67 | 0.64 | 0.46 | 0.60 |
| MC3 | 0.85 | 0.72 | 0.76 | 0.93 | 0.83 | 0.85 | 0.85 | 0.74 | 0.77 |
| R(2+1)D | 0.76 | 0.58 | 0.68 | 0.81 | 0.64 | 0.74 | 0.60 | 0.44 | 0.57 |
| I3D | 0.74 | 0.69 | 0.79 | 0.76 | 0.72 | 0.83 | 0.75 | 0.69 | 0.78 |
| R3D | 0.82 | 0.62 | 0.67 | 0.73 | 0.61 | 0.72 | 0.83 | 0.65 | 0.69 |
| CubeRes (w/o) | 0.90 | 0.87 | 0.86 | 0.91 | 0.87 | 0.88 | 0.90 | 0.85 | 0.87 |
| CuCoRes (w/E) | 0.92 | 0.86 | 0.85 | 0.92 | 0.88 | 0.88 | 0.92 | 0.86 | 0.87 |
| CuCoRes | 0.96 | 0.91 | 0.90 | 0.97 | 0.93 | 0.93 | 0.95 | 0.89 | 0.91 |
4.4 Ablation Study
Our approach incorporates three key attributes: 1) Three reservoirs in CuCoRes' hidden layer to adequately capture multi-directional dynamics; 2) Spatial correlation adjustments to strengthen correlations with nearby points while reducing those with distant ones, enabling accurate dynamic capture; 3) A direct-solvable model distance measurement to evaluate the difference between CuCoRes models.
For the first attribute, we exclude experiments with the LMS method using ESN (with one reservoir) to fit GPR data blocks [Liu et al., 2024], due to the impractically large size of the ESN readout model, which is 200×16×reservoir size when fitted along the detecting direction, and is not directly classifiable. In contrast, CuCoRes captures multidirectional dynamics more compactly with a fitted model size of 3×reservoir size, enabling efficient learning on the models.
For the second, we perform clustering on CuCoRes models but remove spatial correlation adjustments E during fitting, denoted as CuCoRes (w/o E) in Table 3, where introducing spatial correlation adjustments improves clustering by about 5%, achieving a more accurate dynamic capture and category-discriminative model space. As for the third, using Euclidean Distance to replace the introduced model distance measurement, as indicated by CuCoRes (ED.) in Table 2, decreases the effectiveness of anomaly detection by about 3%.
5 Conclusion
This study proposes learning in the CuCoRes model space for anomaly detection in 3D GPR data: 1) CuCoRes, incorporating three reservoirs and spatial correlation adjustment, effectively captures multi-directional dynamics into compact fitted models; 2) Representing GPR data with fitted models enables anomaly detection in category-discriminative model space, distinguishing anomalies while grouping same-type ones; 3) Our approach relies on limited, easily accessible normal GPR data, enhancing practicality in real-world scenarios. Future work will explore reconstructing anomaly regions for intuitive visualization to aid repairs.
Acknowledgments
This work was supported in part by the National Natural Science Foundation of China (No. 62206261, 62137002, 62176245), in part by the Fundamental Research Funds for the Central Universities (No. WK2150110039).
@inproceedings{ijcai2025p801,
  title     = {Underground Diagnosis in 3D GPR Data by Learning in CuCoRes Model Space},
  author    = {Zhou, Xiren and Liu, Shikang and Yan, Xinyu and Wang, Xiangyu and Chen, Huanhuan},
  booktitle = {Proceedings of the Thirty-Fourth International Joint Conference on
               Artificial Intelligence, {IJCAI-25}},
  publisher = {International Joint Conferences on Artificial Intelligence Organization},
  editor    = {James Kwok},
  pages     = {7200--7208},
  year      = {2025},
  month     = {8},
  note      = {Main Track},
  doi       = {10.24963/ijcai.2025/801},
  url       = {https://doi.org/10.24963/ijcai.2025/801},
}
TY - CPAPER TI - Underground Diagnosis in 3D GPR Data by Learning in CuCoRes Model Space AU - Zhou, Xiren AU - Liu, Shikang AU - Yan, Xinyu AU - Wang, Xiangyu AU - Chen, Huanhuan T2 - Proceedings of the Thirty-Fourth International Joint Conference on Artificial Intelligence, IJCAI-25 PB - International Joint Conferences on Artificial Intelligence Organization PY - 2025 SP - 7200 EP - 7208 DO - 10.24963/ijcai.2025/801 UR - https://doi.org/10.24963/ijcai.2025/801 ER -Copied
Machine-readable versions of this paper, for tools and AI agents:





