
AlphaGAT: A Two-Stage Learning Approach for Adaptive Portfolio Selection
Proceedings of the Thirty-Fourth International Joint Conference on Artificial Intelligence. Main Track. Pages 7500-7508.
https://doi.org/10.24963/ijcai.2025/834
Keywords
- Machine Learning: ML: Reinforcement learning
- Multidisciplinary Topics and Applications: MTA: Finance
Abstract
Portfolio selection is a critical task in finance, involving the allocation of resources across various assets. However, current methods often struggle to maintain robust performance due to the inherent low signal-to-noise ratio in raw financial data and shifts in data distribution. We propose AlphaGAT, a novel two-stage learning approach for portfolio selection, designed to adapt to different market scenarios. Inspired by the concept of alpha factors, which transform historical market data into actionable signals, the first stage introduces an advanced model named CATimeMixer for alpha factor generation with a novel loss function to improve the effectiveness and robustness. CATimeMixer integrates TimeMixer with Conv1D (C) and cross-asset Attention (A). Specifically, Conv1D enhances TimeMixer by capturing trend and seasonal features across different scales, while cross-asset attention enables TimeMixer to extract interrelationships between different assets. The second stage applies reinforcement learning to dynamically adjust weights, integrating alpha factors into trading signals. Recognizing the varying effectiveness of alpha factors across different periods, our RL agent innovatively transforms the alpha factors into graphs and employs graph attention networks (GAT) to discern the significance of different alpha factors, enhancing policy robustness. Extensive experiments on real-world market data show that our approach outperforms state-of-the-art methods.
- [Agarwal et al., 2006] Amit Agarwal, Elad Hazan, Satyen Kale, and Robert E. Schapire. Algorithms for portfolio management based on the newton method. In William W. Cohen and Andrew W. Moore, editors, Proc. of ICML, vol- ume 148, pages 9-16, 2006.
- [Chen et al., 2021] Wei Chen, Manrui Jiang, Wei-Guo Zhang, and Zhensong Chen. A novel graph convolutional feature based convolutional neural network for stock trend prediction. Information Sciences, 556:67-94, 2021.
- [Choi et al., 2024] Donghee Choi, Jinkyu Kim, Mogan Gim, Jinho Lee, and Jaewoo Kang. Deepclair: Utilizing mar- ket forecasts for effective portfolio selection. In Proceed- ings of the 33rd ACM International Conference on In- formation and Knowledge Management, CIKM '24, page 4414-4422, New York, NY, USA, 2024. Association for Computing Machinery.
- Thomas M Cover. Universal portfolios. Math- ematical finance, 1(1):1-29, 1991.
- [Du et al., 2021] Yuntao Du, Jindong Wang, Wenjie Feng, Sinno Jialin Pan, Tao Qin, Renjun Xu, and Chongjun Wang. Adarnn: Adaptive learning and forecasting of time series. In Proc. of CIKM, pages 402-411, 2021.
- [Gao and Zhang, 2013] Li Gao and Weiguo Zhang. Weighted moving average passive aggressive algo- rithm for online portfolio selection. In International Conference on Intelligent Human-Machine Systems and Cybernetics, volume 1, pages 327-330. IEEE, 2013.
- [Jiang et al., 2017] Zhengyao Jiang, Dixing Xu, and Jinjun Liang. A deep reinforcement learning framework for the financial portfolio management problem. arXiv preprint arXiv:1706.10059, 2017.
- [Kumar and Yadav, 2024] Arun Kumar and Sanjay Yadav. A multiobjective multiperiod efficient portfolio selection ap- proach for positive and negative returns using rdm-dea un- der credibilistic framework. IEEE Transactions on Engi- neering Management, 71:14114-14125, 2024.
- [Lee et al., 2020] Jinho Lee, Raehyun Kim, Seok-Won Yi, and Jaewoo Kang. MAPS: multi-agent reinforcement learning-based portfolio management system. In Christian Bessiere, editor, Proc. of IJCAI, pages 4520-4526, 2020. IJCAI
- [Li and Hoi, 2012] Bin Li and Steven C. H. Hoi. On-line portfolio selection with moving average reversion. In Proc. of ICML, 2012.
- [Li and Hoi, 2014] Bin Li and Steven CH Hoi. Online port- folio selection: A survey. ACM Computing Surveys (CSUR), 46(3):1-36, 2014.
- [Li et al., 2022] Xiaojie Li, Chaoran Cui, Donglin Cao, Juan Du, and Chunyun Zhang. Hypergraph-based reinforce- ment learning for stock portfolio selection. In Proc. of ICASSP, pages 4028-4032. IEEE, 2022.
- [Liu et al., 2022a] Xiao-Yang Liu, Ziyi Xia, Jingyang Rui, Jiechao Gao, Hongyang Yang, Ming Zhu, Christina Wang, Zhaoran Wang, and Jian Guo. Finrl-meta: Market environ- ments and benchmarks for data-driven financial reinforce- ment learning. Proc. of NeurIPS, 35:1835-1849, 2022.
- [Liu et al., 2022b] Xiao-Yang Liu, Ziyi Xia, Jingyang Rui, Jiechao Gao, Hongyang Yang, Ming Zhu, Christina Wang, Zhaoran Wang, and Jian Guo. Finrl-meta: Market environ- ments and benchmarks for data-driven financial reinforce- ment learning. Advances in Neural Information Process- ing Systems, 35:1835-1849, 2022.
- [Markowitz and Markowitz, 1967] Harry M Markowitz and Harry M Markowitz. Portfolio selection: efficient diversi- fication of investments. J. Wiley, 1967.
- [Niu et al., 2022] Hui Niu, Siyuan Li, and Jian Li. Meta- trader: An reinforcement learning approach integrating diverse policies for portfolio optimization. In Proc. of CIKM, pages 1573-1583, 2022.
- [Qin et al., 2017] Yao Qin, Dongjin Song, Haifeng Chen, Wei Cheng, Guofei Jiang, and Garrison W. Cottrell. A dual-stage attention-based recurrent neural network for time series prediction. In Proc. of IJCAI, pages 2627- 2633, 2017. IJCAI
- [Schulman et al., 2017] John Schulman, Filip Wolski, Pra- fulla Dhariwal, Alec Radford, and Oleg Klimov. Prox- imal policy optimization algorithms. arXiv preprint arXiv:1707.06347, 2017.
- [Vaswani et al., 2017] Ashish Vaswani, Noam Shazeer, Niki Parmar, Jakob Uszkoreit, Llion Jones, Aidan N Gomez, Łukasz Kaiser, and Illia Polosukhin. Attention is all you need. Proc. of NeurIPS, 30:5998-6008, 2017.
- [Velickovic et al., 2018] Petar Velickovic, Guillem Cucurull, Arantxa Casanova, Adriana Romero, Pietro Liò, and Yoshua Bengio. Graph attention networks. In Proc. of ICLR, 2018.
- [Wang et al., 2021] Zhicheng Wang, Biwei Huang, Shikui Tu, Kun Zhang, and Lei Xu. Deeptrader: A deep rein- forcement learning approach for risk-return balanced port- folio management with market conditions embedding. In Proc. of AAAI, pages 643-650, 2021.
- [Wang et al., 2024] Shiyu Wang, Haixu Wu, Xiaoming Shi, Tengge Hu, Huakun Luo, Lintao Ma, James Y. Zhang, and JUN ZHOU. Timemixer: Decomposable multiscale mix- ing for time series forecasting. In The Twelfth Interna- tional Conference on Learning Representations, 2024.
- [Xu et al., 2021a] Ke Xu, Yifan Zhang, Deheng Ye, Peilin Zhao, and Mingkui Tan. Relation-aware transformer for portfolio policy learning. In Proc. of IJCAI, pages 4647- 4653, 2021. IJCAI
- [Xu et al., 2021b] Wentao Xu, Weiqing Liu, Lewen Wang, Yingce Xia, Jiang Bian, Jian Yin, and Tie-Yan Liu. Hist: A graph-based framework for stock trend forecast- ing via mining concept-oriented shared information. arXiv preprint arXiv:2110.13716, 2021.
- [Yang et al., 2022] Mengyuan Yang, Xiaolin Zheng, Qian- qiao Liang, Bing Han, and Mengying Zhu. A smart trader for portfolio management based on normalizing flows. In Proc. of IJCAI, pages 4014-4021, 2022. IJCAI
- [Yang et al., 2023] Mengyuan Yang, Mengying Zhu, Qian- qiao Liang, Xiaolin Zheng, and Menghan Wang. Spotlight news driven quantitative trading based on trajectory opti- mization. In Proc. of IJCAI, pages 4930-4939, 2023. IJCAI
- [Zhang et al., 2022] Yifan Zhang, Peilin Zhao, Qingyao Wu, Bin Li, Junzhou Huang, and Mingkui Tan. Cost-sensitive portfolio selection via deep reinforcement learning. IEEE Trans. Knowl. Data Eng., 34(1):236-248, 2022.
- [Zhang et al., 2023] Qiuyue Zhang, Yunfeng Zhang, Xunxi- ang Yao, Shilong Li, Caiming Zhang, and Peide Liu. A dy- namic attributes-driven graph attention network modeling on behavioral finance for stock prediction. ACM Trans- actions on Knowledge Discovery from Data, 18(1):1-29, 2023.
References were extracted automatically from the PDF and may contain errors.
Full text extracted automatically from the PDF; figures, tables and equations may differ. The PDF is the version of record.
1 Introduction
Portfolio selection, a key aspect of modern finance, involves strategically allocating assets to optimize returns while managing risk [Li and Hoi, 2014]. This task of achieving a lowrisk, high-yield portfolio has been a significant and challenging issue, drawing extensive research interest [Kumar and Yadav, 2024]. Traditional portfolio selection methods often depend on specific assumptions about asset price temporal patterns [Markowitz and Markowitz, 1967]. Although these methods can be effective in certain situations, their adaptability to dynamic market conditions is limited, leading to potential shortcomings in practical applications.
∗Corresponding Author
Recently, machine learning techniques have gained traction in addressing portfolio selection challenges, primarily categorized into two groups: supervised learning (SL) and reinforcement learning (RL). Firstly, SL-based methods leverage deep neural networks (DNNs) such as convolutional networks [Chen et al., 2021], recurrent networks [Qin et al., 2017], and graph networks [Zhang et al., 2023; Choi et al., 2024] to extract temporal and spatial features from market data. These methods focus on predicting asset price movements and optimizing investment strategies based on trend forecasts, utilizing expertise and specialized knowledge. RL-based methods generate portfolio weights as actions through end-to-end learning. These methods optimize investment strategies through interactions with an environment, receiving feedback in the form of rewards or penalties based on actions, eliminating the need for manually labeled data. These methods offer flexibility by designing various reward functions, allowing for diverse decision objectives and a balance between risk and return. Efforts to enhance RL-based methods include the utilization of advanced network structures [Xu et al., 2021a; Li et al., 2022], the design of appropriate reward functions [Zhang et al., 2022; Wang et al., 2021].
However, despite achieving promising performance, practical applications of these methods encounter several limitations. Firstly, the inherent volatility of financial markets results in frequent fluctuations, introducing substantial noise into raw market data and posing a significant challenge for accurate prediction and investment strategies [Liu et al., 2022a]. Secondly, market dynamics can induce shifts in data distributions, adversely affecting model performance on future data. Existing methods often struggle to dynamically adapt their strategies to evolving market conditions, impeding the realization of truly adaptive portfolios. It is imperative to explore innovative approaches that enhance the robustness and adaptability of machine learning-based investment strategies in dynamic financial markets.
In this paper, we propose AlphaGAT, a two-stage RL approach designed to enhance adaptive portfolio selection by integrating alpha (Alpha) factors and graph attention networks (GAT). The first stage addresses the challenge of significant noise in raw market data by transforming this data into alpha factors using SL. Alpha factors are well-established as indicative signal patterns that offer a clearer and more reliable analysis of market trends compared to raw financial data, which often suffers from a low signal-to-noise ratio. To achieve this transformation, we introduce a novel neural network architecture, i.e., CATimeMixer, which combines TimeMixer with Conv1D (C) and cross-asset attention (A). Conv1D is integrated into TimeMixer for adequate feature extraction between trend and seasonal features at different scales, which cross-asset attention is utilized to uncover interrelationships between different assets. Moreover, a novel loss function is proposed to enhance the effectiveness and robustness of the generated alpha factors. Specifically, the loss function incorporates the covariance matrix, improving that the obtained alpha factors are not confined to specific market conditions.
In the second stage, a RL algorithm enhanced with GAT dynamically adjusts the weights assigned to alpha factors, optimizing their combination into actionable trading signals. This process is critical, as the effectiveness of alpha factors varies significantly across time periods. Through trial and error, the RL agent learns resilient policies that adapt to diverse market scenarios, minimizing human bias and promoting a data-driven decision-making approach. GAT plays a pivotal role by modeling complex dependencies among alpha factors, incorporating temporal dynamics, and reducing reliance on any single factor. By representing alpha factors as nodes in a graph, GAT enables information aggregation across multiple factors, empowering the RL agent to make more informed and robust portfolio decisions. This approach significantly enhances the adaptability and robustness of investment strategies in volatile and unpredictable markets.
Our main innovations are summarized as follows:
- A novel network, CATimeMixer is introduced to transform the raw historical market data into diverse alpha factors, which is efficient for extracting the temporal features of individual assets and the interrelationships between different assets.
- Covariance matrix is integrated into loss function to enhance the robustness and effectiveness of alpha factors.
- By innovatively transforming alpha factors into graphs in the second stage and utilizing GAT to determine the significance, AlphaGAT achieves an adaptive portfolio selection and reduces reliance on any single factor.
Finally, extensive experiments have been conducted on realworld stock market and cryptocurrency market demonstrated that AlphaGAT outperforms state-of-the-art methods.
2 RelatedWork
Traditional portfolio selection strategies, such as momentum trading [Li and Hoi, 2014] and mean reversion [Markowitz and Markowitz, 1967], heavily rely on assumptions regarding temporal patterns in time series data. Nevertheless, the effectiveness of these methods is often constrained by the inconsistent adherence of these assumptions in real-world markets. This limitation impairs the adaptability and overall efficacy of these strategies.
The rapid advancement of deep neural networks (DNN) has elevated deep learning to a pivotal role in addressing timeseries analysis challenges. Investment strategies for portfolio selection, particularly those grounded in supervised learning, leverage neural networks to predict asset trends and determine portfolio weights according to predefined rules. Researchers seek to enhance prediction accuracy primarily through two avenues: (1) innovating more sophisticated neural network structures [Qin et al., 2017; Zhang et al., 2023; Choi et al., 2024]; and (2) introducing novel representation learning objectives [Xu et al., 2021b].
Recent advancements in portfolio selection leverage RL, enabling the learning of dynamic strategies through trial and error. On the one hand, to extract effective features from raw market data, the researchers designed different network architectures and further expanded the feature dimensions of the state space [Yang et al., 2023]. For example, EIIE [Jiang et al., 2017] uses the same network structure for temporal feature extraction for each asset independently. To capture both sequential patterns and asset correlations for portfolio selection, RAT [Xu et al., 2021a] is proposed to simultaneously model complex sequential patterns and varying asset correlations based on Transformer[Vaswani et al., 2017]. On the other hand, with different risk appetites, previous RLbased methods carefully designed risk-sensitive reward functions [Niu et al., 2022] and adopted multi-agent RL [Lee et al., 2020] to strike a balance between return and risk. To be specific, the state-of-the-art one is PPN [Zhang et al., 2022], which develops a new cost-sensitive reward function to constrain both transaction and risk costs during the optimization.
3 Problem Setting
The definition of alpha factors is presented, followed by Markov decision process (MDP) for portfolio selection according to the RL paradigm.
3.1 Alpha Factors
Alpha factors are essential in quantitative analysis and investment strategies, serving as indicators to evaluate the potential returns of assets or strategies. They can be mined using two main approaches: formulaic methods, which rely on predefined mathematical rules such as technical indicators, and machine learning-based methods, which use advanced computational techniques to discover predictive patterns from historical data. This paper leverages the powerful learning capabilities of deep neural networks, focusing on machine learning to mine alpha factors.
Each asset i at period t with d basic features (e.g., open, high, close) is represented as Xt i ∈ Rd . The features of all m assets at this period are denoted as Xt ∈ Rm×d . Let Xt = {Xt-k, ...,Xt-1} ∈ Rk×m×d represent the raw features of all m assets from the previous k periods leading up to time t. The alpha factor f is a function mapping these feature vectors to alpha values zt = f(Xt) ∈ Rm. Let an alpha set Zt = {Z 1 t , ...,Z n t } ∈ Rn×m contains n different alpha factors F = {f1, ..., fn}, which improve the robustness and predictive capability of portfolio selection.
3.2 Markov Decision Process
A standard MDP can be represented as M =< S, A, T, R >, where S represents the state space, A is the action space. T(s′ |s, a) characterizes the probabilistic transition from the current state s to the next state s′ following action a, and R is the reward function. Additionally, the policy function π(s) = a, s ∈ S, a ∈ A defines the strategy or decisionmaking rule that specifies the action to take in each state. The primary objective of an MDP is typically to identify an optimal policy that maximizes expected rewards over time.
In the context of portfolio selection, the state st observed by the agent at time t includes historical asset prices, market conditions, economic indicators, and other relevant data. The action at corresponds to the portfolio weights wt, and the reward is defined as ˜ rt = wt T pt - 1, where pt is the price relative vector (the ratio of the asset's closing price at time t to that at t - 1). When accounting for transaction costs, the reward is adjusted as rt := (˜ rt + 1)(1 - ct) - 1, with ct denoting the proportion of transaction costs.
4 Methodology
4.1 Overview of AlphaGAT
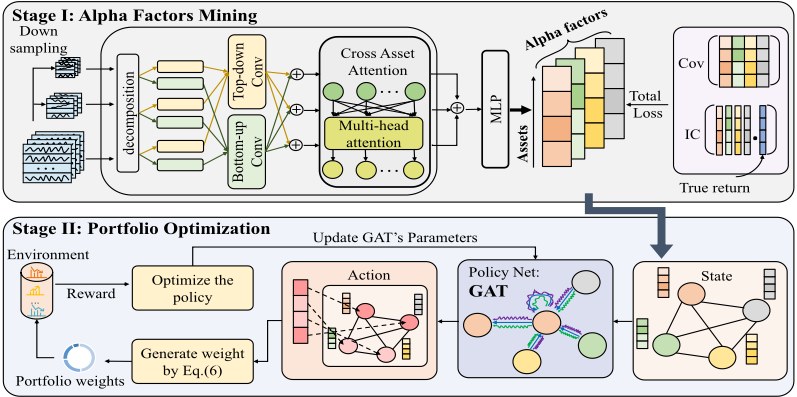
As illustrated in Figure 1, the framework of AlphaGAT consists primarily of two key components: alpha mining and portfolio optimization. (1) In stage I, alpha factors are derived from raw asset price data based on SL. We employ a novel model efficiently captures temporal features and correlation information. To enhance the overall robustness of the alpha set, covariance between different alpha factors has been incorporated into the loss function. (2) In stage II, based on obtaining alpha factors in stage I, the portfolio optimization is carried out using the RL algorithm, i.e., Proximal Policy Optimization (PPO) [Schulman et al., 2017]. During interactions with the environment, the RL agent dynamically adjusts the significance of different factors with the GAT. This adaptive adjustment enhances the flexibility and responsiveness of the method, enabling it to better adapt to changing conditions and improve overall performance.
4.2 Stage I: Alpha Factors Mining
Alpha factor mining involves using advanced neural network models named CATimeMixer to extract predictive signals (alpha factors) from raw market data in SL way. Raw market data encompasses multiple dimensions: (1) time series information for individual assets, enabling the prediction of future asset movements based on historical price patterns, and (2) correlation information among multiple assets, reflecting how different assets may exhibit similar or divergent trends within a given period.
Extracting Temporal Features
Inspired by state-of-the-art temporal feature extraction model TimeMixer [Wang et al., 2024], we first employ a downsampling technique to extend the original data Xt into L scales by average pooling and obtain a set of different scale data {X 0 t , ...,X L t }. Each i-scale data X i t ∈ R k ⌊2i⌋ ×m×d is decomposed into Seit and Tri t from the perspectives of trend and seasonal. For trend extraction, we adopt a top-down approach, leveraging high-scale macro information to enhance the insights derived from lower-scale data. Conversely, seasonal feature extraction employs a bottom-up strategy, incorporating information from lower-level fine-scale time series and aggregating these insights to create a more comprehensive view upward through the scales.
We innovatively utilize Conv1D to extract features from two distinct directions. Conv1D excels at hierarchical feature extraction by using convolutional layers to capture and integrate information across multiple temporal scales in time series data. In contrast to MLPs, which typically fuse features from adjacent scales, Conv1D constructs a comprehensive representation by progressively aggregating features. As illustrated in Figure 2, this multi-scale approach enables Conv1D to effectively model both fine-grained details and broader trends, thereby enhancing its capability to capture complex temporal patterns and interactions within the data. Detailed comparisons of experimental results are provided in Table 4.
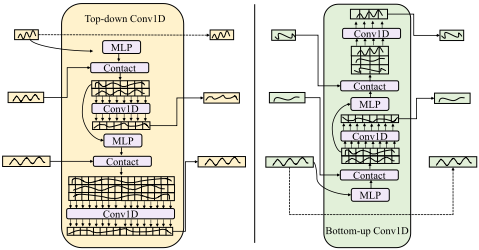
Leveraging this approach, we can derive the updated trend feature ˆ T ri t and seasonal feature ˆ Seit , which are then combined to produce Hi t .
Extracting Correlation Features
The network modules above independently capture the temporal embeddings Hi t for each asset i, but they do not account for correlations between different assets. we incorporate multi-head attention (MHA) [Vaswani et al., 2017] to extract and integrate correlation information across assets.
Let Hi t = {Hi0 t , . . . ,H im t } represent the feature vectors of multiple assets at period t, where Hij t denotes the feature of asset j at scale i. To capture the interrelationships among these assets, we apply MHA to compute the correlations for each period independently, resulting in Ei t = MHA(Hi0 t , . . . ,H im t ).
The CATimeMixer architecture consists of a stack of 3 identical layers. In each layer, the output Ei t from the MultiHead Attention (MHA) module is fed back as input X i t for the next layer. This iterative process of interleaving temporal and relational feature extraction ensures robust capture of essential information from historical data. Consequently, it improves the accuracy of future trend predictions and facilitates the generation of high-quality alpha factors.
Alpha Factors Generator
To fully leverage the multi-scale information, we use an MLP to transform the features at each scale into alpha factors and then aggregate the predictions from the multi-scale series. This process is represented as Zt = ∑Li=0 MLP(Ei t ).
Loss Function
A novel loss function is proposed which focuses on two key aspects: maximizing the effectiveness of alpha factors in predicting future price movements and minimizing the correlation among factors to enhance their diversity and robustness.
Objective 1: The primary objective is to maximize the mean Information Coefficient (IC) of the alpha factors, which quantifies their predictive accuracy. The IC, defined as the pearson correlation coefficient between the alpha factors Z i t and the ground truth of asset price movements yt, is averaged across all factors and time periods. The loss function Licminimizes the negative average IC, guiding the model to improve the predictive accuracy of the alpha factors.
Objective 2: To reduce correlations between different alpha factors, a regularization termLcov is introduced, based on the sum of the off-diagonal elements of the covariance matrix C of the factors. This term encourages the model to produce alpha factors that are diverse and less correlated, thereby improving the overall robustness of predictive accuracy.
The total loss function for training the neural network is a combination of these two objectives, expressed as:
where λ is a hyperparameter that balances the importance of prediction accuracy and factor diversity. By minimizing this combined loss function, the model is trained to alpha factors forecast market trends while ensuring their diversity, leading to a more effective and robust portfolio selection strategy.
4.3 Stage II: Portfolio Optimization
In stage II, we employ RL algorithms to dynamically adjust the weights of the alpha factors obtained in stage I, resulting in an adaptive portfolio strategy. This weight adjustment is crucial to ensure that the portfolio strategy remains effective under varying market conditions. By adapting the weights of alpha factors, priority is given to factors that are most relevant to trading signals, while minimizing the impact of less effective factors. RL facilitates the learning of optimal portfolio strategies by continuously interacting with the market environment, thereby maximizing returns and minimizing risks through responsive adjustments to alpha factor weights.
Algorithm 1 Training Algorithm of Stage II
- 1: Initialize policy network πθ and value network vϕ
- 2: Initialize the replay buffer D
- 3: Load the modelMtraind in stage I
- 4: for episode = 1 to Mdo
- 5: Initialize raw market data X0
- 6: Initialize alpha factors Zt =M(X0)
- 7: for t = 0 to T-1 do
- 8: Select action at ∼ πθ(at|Zt)
- 9: Execute action at, observe reward rt and next raw market data Xt+1
- 10: Generate alpha factors Zt+1 =M(Xt+1)
- 11: Store transition Zt, at, rt, Zt+1 in D
- 12: end for
- 13: Compute advantages ˆ At
- 14: Update θ and ϕ using gradient descent
- 15: end for
Our adoption of RL optimizes portfolio selection, enabling it to adapt to changing market conditions and learn dynamic strategies that efficiently allocate assets.
To this end, we need to model the problem as MDP as presented in the section 3.2. It's essential to highlight two key distinctions in our proposed method, AlphaGAT, compared to existing RL-based approaches, particularly in the state space and action space.
State: At the time period t, the state st is defined as the alpha factors Zt mined in the first stage. This is a departure from previous RL-based methods where the state was comprised of raw market features Xt. Raw market features often have a low signal-to-noise ratio, making it challenging to learn a robust strategy in a non-stationary environment. To overcome this challenge, we utilize alpha factors mined in stage I to construct the state space. This approach significantly reduces the impact of noise and creates a more conducive environment for acquiring an optimal strategy.
Action: The action is defined as the weight that aggregates different alpha factors into trading signals. This approach offers advantages in diversifying the portfolio and reducing the risk of overfitting, leading to more robust and effective investment strategies. The policy function is defined as at = π(st) = qt, where qt is the weight for aggregating the alpha factors to the trading signals v = qt ∗ Zt. Let G be the top G assets in the trading signals and the investment weights wi for asset i are obtained as the following formula.
GAT
To leverage the relationships among different alpha factors, we employ GAT [Velickovic et al., 2018] as the policy network of agents. GAT not only considers the individual predictive accuracy of each factor but also harnesses the collective information of different factors. In the graph representation, each alpha factor is treated as an independent node, representing its unique characteristics. The graph is fully connected, with each node linked to every other. GAT computes attention coefficients for factor i by considering its neighbors.
where ⃗aT and ⃗W are learnable weight vectors and matrices, Z i t and Z j t represent alpha factor i and j at period t. After calculating the attention coefficients for all neighbors of the factor i, they are normalized via the softmax function to ensure they sum to 1. The normalized attention coefficient between factors i and j is denoted as αi,j. GAT then aggregates the features of factor i's neighbors, weighted by these attention coefficients.
where ⃗hi denotes the updated feature representation of alpha factor i, σ represents the activation function.
To capture various relational aspects, multiple attention heads with distinct learnable weight vectors are employed. Finally, the weight of alpha factor i at period t is computed using softmax, with Wo and bo as learnable parameters.
PPO
To maintain the stability and robustness, PPO [Schulman et al., 2017] is chosen to optimize the policy π(st) which dynamically adjusts alpha factor weights in adaptive portfolio strategies. Its adaptability, sample efficiency, and ability to handle complex action spaces ensure effective learning and resilience in different financial markets, optimizing stable returns. The detailed training process is Algorithm 1.
5 Experiments
To comprehensively evaluate AlphaGAT, we conduct experiments on the constituent stocks of three representative stock indices, aiming to answer the following questions: Q1 How is the overall performance of our proposed method under real market conditions? Q2 Does the architecture proposed in stage I improve the effectiveness of alpha factor mining? Q3 Can RL enhance factor combination effects? Q4 How the first and second phases of AlphaGAT work together?
5.1 Experimental Settings
Datasets
To encompass various global stock markets and reduce human-selected interventions, experimental datasets comprise constituent stocks of Dow Jones Industrial Average (DJIA) in the U.S. market, Hang Seng Index (HSI) in the Hong Kong market, and CSI 100 Index in the Chinese Ashare market. Additionally, we incorporate the cryptocurrency market (CRYPTO) to demonstrate the method's effectiveness across different types of markets. We utilize 8 raw assets' features: [open, close, high, low, volume, vwap, turn, chg]. The historical data is partitioned into the training, validation, and test set in an 8:1:1 ratio. Notably, due to missing data, some companies are excluded from the experiments.
| Strategies | CSI | |||||||||||||||
|---|---|---|---|---|---|---|---|---|---|---|---|---|---|---|---|---|
| CW↑ | DJIA APY ↑ | ASR ↑ | CR ↑ | CW↑ | APY ↑ | HSI ASR ↑ | CR ↑ | CW↑ | APY ↑ | ASR ↑ | CR ↑ | CW↑ | APY ↑ | CRYPTO ASR ↑ | CR ↑ | |
| BAH | 1.032 | 0.023 | 0.132 | 0.112 | 0.903 | -0.075 | -0.322 | -0.241 | 0.967 | -0.025 | -0.140 | -0.130 | 1.779 | 0.870 | 2.004 | 1.563 |
| DynamicCRP | 1.043 | 0.031 | 0.158 | 0.149 | 0.798 | -0.157 | -0.568 | -0.504 | 0.703 | -0.236 | -0.732 | -0.615 | 1.839 | 0.938 | 2.269 | 1.896 |
| EG | 1.035 | 0.026 | 0.143 | 0.123 | 0.919 | -0.062 | -0.256 | -0.201 | 0.980 | -0.015 | -0.082 | -0.076 | 1.836 | 0.935 | 2.256 | 1.881 |
| Traditional OLMAR | 0.473 | -0.425 | -1.179 | -0.704 | 0.235 | -0.666 | -1.090 | -0.850 | 0.156 | -0.759 | -1.536 | -0.898 | 0.659 | -0.364 | -0.572 | -0.797 |
| ONS | 1.014 | 0.011 | 0.040 | 0.043 | 1.080 | 0.060 | 0.121 | 0.128 | 0.861 | -0.108 | -0.346 | -0.344 | 1.650 | 0.722 | 2.553 | 2.848 |
| UP | 1.035 | 0.026 | 0.143 | 0.123 | 0.919 | -0.062 | -0.255 | -1.996 | 0.980 | -0.015 | -0.083 | -0.077 | 1.837 | 0.936 | 2.259 | 1.883 |
| WMAMR | 0.566 | -0.344 | -1.002 | -0.682 | 0.625 | -0.299 | -0.501 | -0.478 | 0.380 | -0.524 | -1.198 | -0.758 | 0.663 | -0.360 | -0.638 | -0.908 |
| ALSTM | 1.020 | 0.015 | 0.062 | 0.064 | 0.905 | -0.073 | -0.165 | -0.180 | 0.805 | -0.153 | -0.357 | 0.391 | 1.570 | 0.633 | 1.446 | 0.944 |
| SL AdaRNN | 1.091 | 0.067 | 0.247 | 0.288 | 0.796 | -0.158 | -0.463 | -0.389 | 1.008 | 0.006 | 0.015 | 0.019 | 1.342 | 0.377 | 1.310 | 1.011 |
| PPN | 1.021 | 0.015 | 0.086 | 0.072 | 0.963 | -0.028 | -0.096 | -0.084 | 0.906 | -0.073 | -0.165 | -0.207 | 1.581 | 0.645 | 1.278 | 0.982 |
| RAT | 1.179 | 0.129 | 0.589 | 0.655 | 1.109 | 0.081 | 0.170 | 0.234 | 0.914 | -0.066 | -0.208 | -0.211 | 1.885 | 0.991 | 1.809 | 1.127 |
| RL FinRL-Meta | 1.093 | 0.068 | 0.318 | 0.340 | 1.082 | 0.062 | 0.194 | 0.214 | 1.040 | 0.031 | 0.105 | 0.119 | 2.561 | 1.777 | 4.297 | 4.120 |
| ours | 1.428 | 0.302 | 1.367 | 1.507 | 1.359 | 0.261 | 0.742 | 0.989 | 1.239 | 0.178 | 0.654 | 0.666 | 3.288 | 2.643 | 5.008 | 3.661 |
| Datasets | #Assets | Training | Validation | Test |
|---|---|---|---|---|
| DJIA | 29 | 2010-01 to 2020.09 | 2020-09 to 2022-01 | 2022-01 to 2023-06 |
| HSI | 56 | 2010-01 to 2020.09 | 2020-09 to 2022-01 | 2022-01 to 2023-06 |
| CSI | 98 | 2010-01 to 2020.09 | 2020-09 to 2022-01 | 2022-01 to 2023-06 |
| CRYPTO | 18 | 2018-01 to 2023.01 | 2023-01 to 2023-09 | 2023-09 to 2024-04 |
Baselines
Our method is compared with three different types of stateof-the-art portfolio selection methods: traditional investment strategies, i.e., BAH (Buy and Hold), DynamicCRP, OLMAR [Li and Hoi, 2012], UP [Cover, 1991], WMAMR [Gao and Zhang, 2013], ONS [Agarwal et al., 2006]; SL-based methods, i.e., ALSTM [Qin et al., 2017], AdaRNN [Du et al., 2021] and RL-based methods, i.e., RAT [Xu et al., 2021a], PPN [Zhang et al., 2022] and the wide-used benchmarks FinRL-Meta[Liu et al., 2022b] with PPO algorithms.
Metrics
Following the previous work [Yang et al., 2022], four commonly used metrics are selected to provide a comprehensive evaluation of the investment strategies: (1) Cumulative Wealth (CW): Tracks the total portfolio value over time, indicating overall investment performance; (2) Annualized Percentage Yield (APY): Measures the yearly rate of return, accounting for compounding effects; (3) Annualized Sharpe Ratio (ASR): Evaluates risk-adjusted returns, comparing excess returns to the investment's volatility; (4) Calmar Ratio (CR): Compares annual returns to the maximum drawdown, assessing performance relative to significant losses.
Implementation Details
Following the settings in [Li et al., 2022], the transaction cost rate is set to 0.25% to model the real-world trade. The proposed method is implemented by PyTorch and conducted on an NVIDIA RTX 4090 GPU. We adopt Adam optimizer and set the learning rate to 1e-3 in stage I and 5e-4 in stage II. The λ in the loss function of stage I is set to 0.1. The hidden embedding dimension c is 512. The time window size of all methods is 30 and the number of alpha factors in stage I is set to 64. Hyperparameters are tuned based on the validation dataset, and performance is evaluated on the test dataset. AlphaGAT demonstrates robustness to hyperparameters by employing a small set of tunable parameters with stable algorithms like Adam and PPO, and by maintaining fixed hyperparameters from stage I throughout stage II, ensuring robust performance. Additionally, the parameters of the baselines are set to the optimal values reported in their publications, as the optimal parameters of each baseline do not distinguish between datasets according to their publications. All RL-based methods were executed five times with different seeds, and the mean values were calculated for analysis.
5.2 Experimental Result of AlphaGAT
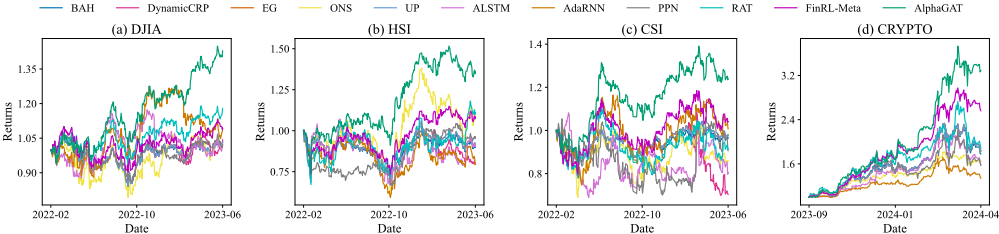
Result 1: Overall Performance. To address Q1, we performed a thorough comparison of AlphaGAT's performance against baseline methods using four standard metrics. Table 1 shows that AlphaGAT consistently surpasses all baseline methods across different markets. Traditional strategies often struggle with profitability, especially in the DJIA market, and generally break even or incur losses in the volatile HSI and CSI markets. In contrast, AlphaGAT achieves notable profitability in all these markets. Although several methods perform well in the cryptocurrency market, AlphaGAT delivers superior results. This exceptional performance is attributed to AlphaGAT's innovative two-stage framework: stage I generates diverse alpha factors from market data for accurate forecasting, while stage II uses RL to dynamically adjust these factors' weights. This approach enhances AlphaGAT's adaptability and effectiveness across various markets.
| DJIA | HSI | CSI | CRYPTO | |||||||||||||
|---|---|---|---|---|---|---|---|---|---|---|---|---|---|---|---|---|
| Strategies | CW↑ | APY ↑ | ASR ↑ | CR ↑ | CW↑ | APY ↑ | ASR ↑ | CR ↑ | CW↑ | APY ↑ | ASR ↑ | CR ↑ | CW↑ | APY ↑ | ASR ↑ | CR ↑ |
| ours | 1.428 | 0.302 | 1.367 | 1.507 | 1.359 | 0.261 | 0.742 | 0.989 | 1.239 | 0.178 | 0.654 | 0.666 | 3.288 | 2.643 | 5.008 | 3.661 |
| MLP | 1.357 | 0.253 | 1.319 | 1.732 | 1.277 | 0.204 | 0.628 | 0.761 | 1.139 | 0.105 | 0.256 | 0.246 | 2.691 | 1.931 | 4.326 | 3.636 |
| rand | 1.182 | 0.131 | 0.714 | 0.895 | 1.132 | 0.099 | 0.299 | 0.378 | 1.085 | 0.065 | 0.240 | 0.239 | 1.909 | 1.018 | 2.553 | 2.079 |
| top-IC | 1.228 | 0.164 | 0.878 | 0.926 | 1.167 | 0.124 | 0.381 | 0.451 | 1.114 | 0.086 | 0.317 | 0.277 | 1.766 | 0.854 | 1.530 | 1.698 |
| eqaul | 1.241 | 0.173 | 0.930 | 1.057 | 1.173 | 0.128 | 0.395 | 0.484 | 1.104 | 0.079 | 0.290 | 0.281 | 1.639 | 0.710 | 2.199 | 2.079 |
| Dataset | Metric | TimeMixer | CTimeMixer | ATimeMixer | CATimeMixer | Improvement(%) | p-value | ||||
|---|---|---|---|---|---|---|---|---|---|---|---|
| DJIA | IC ↑ RankIC ↑ | 0.018 0.021 | ±0.001 ±0.002 | 0.025 0.021 | ±0.002 ±0.001 | 0.019 0.025 | ±0.001 ±0.002 | 0.026 0.027 | ±0.002 ±0.003 | +36.8 +28.4 | 0.000 0.006 |
| HSI | IC ↑ RankIC ↑ | 0.017 0.016 | ±0.002 ±0.002 | 0.018 0.013 | ±0.001 ±0.002 | 0.018 0.018 | ±0.001 ±0.003 | 0.022 0.023 | ±0.002 ±0.003 | +25.4 +45.7 | 0.0061 0.008 |
| CSI | IC ↑ RankIC ↑ | 0.009 0.009 | ±0.001 ±0.002 | 0.010 0.008 | ±0.002 ±0.002 | 0.011 0.016 | ±0.002 ±0.003 | 0.014 0.016 | ±0.001 ±0.002 | +43.1 +82.6 | 0.035 0.001 |
| CRYPTO | IC ↑ RankIC ↑ | 0.034 0.028 | ±0.002 ±0.002 | 0.038 0.029 | ±0.002 ±0.003 | 0.033 0.032 | ±0.001 ±0.003 | 0.039 0.038 | ±0.002 ±0.002 | 16.7 +23.4 | 0.017 0.024 |
Result 2: Validity of Alpha Factors. To address Question Q2, we evaluate the effectiveness of the alpha factors extracted in stage I using two key metrics: the average Information Coefficient (IC) and the Rank Information Coefficient (RankIC).We report the mean and variance of these metrics, and conduct a paired t-test at the 0.05 significance level. The IC measures the predictive accuracy of alpha factors, while RankIC quantifies the correlation between predicted and actual asset rankings. As shown in Table 4, the proposed model outperforms variants, i.e., TimeMixer, CTimeMixer (with Conv1D), ATimeMixer (with cross asset attention). Specifically, the improvements are attributed to: (1) Conv1D's superior multi-scale feature extraction compared to MLP, and (2) cross-asset attention's ability to enhance the identification of inter-asset correlations, thereby increasing the validity of the extracted factors.
Result 3: Ablation Study. To address Question Q3 and assess the contributions of different components in AlphaGAT, we perform ablation experiments with four simplified variants: MLP, rand, top-IC, and equal. In the MLP version, an MLP replaces GAT as the policy network in stage II. The rand version uses random weights for alpha factors, the top-IC version assigns random weights based on the IC of alphas from the previous period, and the equal version distributes equal weights, omitting RL in the second stage. As shown in Table 3, incorporating RL algorithms significantly improves overall profitability, demonstrating their effectiveness in optimizing investment strategies. RL algorithms excel in dynamically adjusting alpha factor weights to maximize cumulative wealth. Compared to MLP, GAT provides superior performance by managing diverse alpha factors and their interrelationships within the graph, leading to more precise decisionmaking. These ablation studies highlight the essential roles of RL and GAT in AlphaGAT, confirming that their integration is crucial for balancing returns with investment stability.
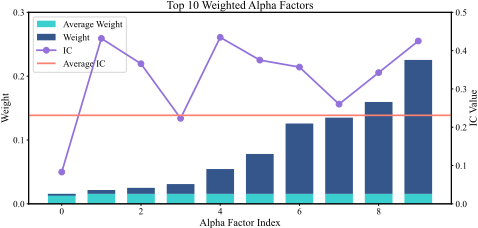
Result 4: Case Study. To address Q4, we conduct a case study to examine the synergy between AlphaGAT's two stages in optimizing investment strategies. Through qualitative analysis, we identify the alpha factors assigned the highest weights by the RL agent. Figure 4 illustrates the top 10 weighted alpha factors and their corresponding IC values during a back-testing step on the DJIA dataset, showing the agent's preference for factors with higher IC values. This highlights AlphaGAT's ability to effectively balance predictive accuracy and adaptability, offering a robust solution for investment strategies in volatile markets.
6 Conclusion
In this paper, we present AlphaGAT, a novel two-stage framework for portfolio selection. In the first stage, raw market data is transformed into alpha factors using the proposed CATimeMixer and a novel loss function. In the second stage, the RL agent with GAT dynamically adjusts the weights of these alpha factors, enabling adaptive portfolio selection. Empirical results demonstrate the method's effectiveness, offering a robust and flexible solution. Future work will explore integrating diverse market data sources, such as news and social media, to further improve the accuracy and comprehensiveness of portfolio selection strategies.
Acknowledgments
This work was supported by the National Natural Science Foundation of China (Grant No. 62173258, 62472376, T2495254). Jinshan Zhang was supported by the Key Research and Development Jianbing Program of Zhejiang Province (2023C01002), Hangzhou Major Project and Development Program (2022AIZD0140) and Yongjiang Talent Introduction Programm (2022A-236-G).
@inproceedings{ijcai2025p834,
  title     = {AlphaGAT: A Two-Stage Learning Approach for Adaptive Portfolio Selection},
  author    = {Li, Shicheng and Zhang, Jinshan and Wang, Feng},
  booktitle = {Proceedings of the Thirty-Fourth International Joint Conference on
               Artificial Intelligence, {IJCAI-25}},
  publisher = {International Joint Conferences on Artificial Intelligence Organization},
  editor    = {James Kwok},
  pages     = {7500--7508},
  year      = {2025},
  month     = {8},
  note      = {Main Track},
  doi       = {10.24963/ijcai.2025/834},
  url       = {https://doi.org/10.24963/ijcai.2025/834},
}
TY - CPAPER TI - AlphaGAT: A Two-Stage Learning Approach for Adaptive Portfolio Selection AU - Li, Shicheng AU - Zhang, Jinshan AU - Wang, Feng T2 - Proceedings of the Thirty-Fourth International Joint Conference on Artificial Intelligence, IJCAI-25 PB - International Joint Conferences on Artificial Intelligence Organization PY - 2025 SP - 7500 EP - 7508 DO - 10.24963/ijcai.2025/834 UR - https://doi.org/10.24963/ijcai.2025/834 ER -Copied
Machine-readable versions of this paper, for tools and AI agents:





