
COGRASP: Co-Occurrence Graph Based Stock Price Forecasting
Proceedings of the Thirty-Fourth International Joint Conference on Artificial Intelligence. Main Track. Pages 7527-7535.
https://doi.org/10.24963/ijcai.2025/837
Keywords
- Multidisciplinary Topics and Applications: MTA: Finance
- Data Mining: DM: Applications
Abstract
Forecasting stock prices is complex and challenging. Uncovering correlations among stocks has proven to enhance stock price forecasting. However, existing correlation discovery methods, such as concept-based methods, are slow, inaccurate, and limited by their reliance on predefined concepts and manual analysis. In this paper, we propose COGRASP, a novel approach for stock price forecasting that constructs stock co-occurrence graphs automatically by analyzing rapidly updated sources such as reports, newspapers, and social media. Besides, we aggregate forecasts across multiple timescales (i.e., long-, medium-, and short-term) to capture multi-timescale trends fluctuations, thereby enhancing price forecasting accuracy. In experiments with real-world open-source stock market data, COGRASP outperforms state-of-the-art methods.
- [Adebiyi et al., 2014] Ayodele Ariyo Adebiyi, Aderemi Oluyinka Adewumi, and Charles Korede Ayo. Comparison of arima and artificial neural networks models for stock price prediction. Journal of Applied Mathematics, 2014(1):614342, 2014.
- [Brown et al., 1998] Stephen J Brown, William N Goetz- mann, and Alok Kumar. The dow theory: William peter hamilton's track record reconsidered. The Journal of fi- nance, 53(4):1311-1333, 1998.
- [Cao and Tay, 2001] Lijuan Cao and Francis EH Tay. Finan- cial forecasting using support vector machines. Neural Computing & Applications, 10:184-192, 2001.
- [Chen and Craig, 2023] Zhongdong Chen and Karen Ann Craig. Active attention, retail investor base, and stock re- turns. Journal of Behavioral and Experimental Finance, 39:100820, 2023.
- [Chen and Guestrin, 2016] Tianqi Chen and Carlos Guestrin. Xgboost: A scalable tree boosting system. In Proceedings of the 22nd acm sigkdd international conference on knowl- edge discovery and data mining, pages 785-794, 2016.
- [Chen et al., 2015] Kai Chen, Yi Zhou, and Fangyan Dai. A lstm-based method for stock returns prediction: A case study of china stock market. In 2015 IEEE interna- tional conference on big data (big data), pages 2823- 2824. IEEE, 2015.
- [Chen et al., 2018a] Kun Chen, Peng Luo, Libo Liu, and Weiguo Zhang. News, search and stock co-movement: In- vestigating information diffusion in the financial market. Electronic Commerce Research and Applications, 28:159- 171, 2018.
- [Chen et al., 2018b] Yingmei Chen, Zhongyu Wei, and Xu- anjing Huang. Incorporating corporation relationship via graph convolutional neural networks for stock price pre- diction. In Proceedings of the 27th ACM international conference on information and knowledge management, pages 1655-1658, 2018.
- [Chi, 2024] China securities depository and clearing corpo- ration. Website, 2024. http://m.chinaclear.cn/. Link
- [Chung and Shin, 2018] Hyejung Chung and Kyung-shik Shin. Genetic algorithm-optimized long short-term mem- ory network for stock market prediction. Sustainability, 10(10):3765, 2018.
- [CTG, 2023] China tourism group duty free corporation limited announcement inside information in december 26, 2023. https://www1.hkexnews.hk/listedco/listconews/ sehk/2023/1226/2023122600201.pdf, 2023. Link
- [Cui et al., 2023] Chaoran Cui, Xiaojie Li, Chunyun Zhang, Weili Guan, and Meng Wang. Temporal-relational hy- pergraph tri-attention networks for stock trend prediction. Pattern Recognition, 143:109759, 2023.
- [Defferrard et al., 2016] Michaël Defferrard, Xavier Bres- son, and Pierre Vandergheynst. Convolutional neural networks on graphs with fast localized spectral filtering. Advances in neural information processing systems, 29, 2016.
- [Fan and Shen, 2024] Jinyong Fan and Yanyan Shen. Stock- mixer: A simple yet strong mlp-based architecture for stock price forecasting. In Proceedings of the AAAI Con- ference on Artificial Intelligence, volume 38, pages 8389- 8397, 2024.
- [Feng and Seasholes, 2004] Lei Feng and Mark S Seasholes. Correlated trading and location. The Journal of finance, 59(5):2117-2144, 2004.
- [Feng et al., 2019] Fuli Feng, Xiangnan He, Xiang Wang, Cheng Luo, Yiqun Liu, and Tat-Seng Chua. Temporal re- lational ranking for stock prediction. ACM Transactions on Information Systems (TOIS), 37(2):1-30, 2019.
- [Feng et al., 2023] Wenzhi Feng, Xiang Ma, Xuemei Li, and Caiming Zhang. A representation learning framework for stock movement prediction. Applied Soft Computing, 144:110409, 2023.
- [Hamilton, 2020] William L Hamilton. Graph representa- tion learning. Morgan & Claypool Publishers, 2020.
- [Hirshleifer et al., 2024] David Hirshleifer, Lin Peng, and Qiguang Wang. News diffusion in social networks and stock market reactions. The Review of Financial Studies, page hhae025, 2024.
- [Hochreiter and Schmidhuber, 1997] Sepp Hochreiter and Jürgen Schmidhuber. Long short-term memory. Neural computation, 9(8):1735-1780, 1997.
- [Hou and Li, 2014] Yang Hou and Steven Li. The impact of the csi 300 stock index futures: Positive feedback trading and autocorrelation of stock returns. International Review of Economics & Finance, 33:319-337, 2014.
- [Hu and Qi, 2017] Hao Hu and Guo-Jun Qi. State-frequency memory recurrent neural networks. In International Con- ference on Machine Learning, pages 1568-1577. PMLR, 2017.
- [Huynh et al., 2023] Thanh Trung Huynh, Minh Hieu Nguyen, Thanh Tam Nguyen, Phi Le Nguyen, Matthias Weidlich, Quoc Viet Hung Nguyen, and Karl Aberer. Effi- cient integration of multi-order dynamics and internal dy- namics in stock movement prediction. In Proceedings of the Sixteenth ACM International Conference on Web Search and Data Mining, pages 850-858, 2023.
- [Just and Petersen, 2023] Sine N Just and Linea Munk Pe- tersen. Yolo publics: The potential for creative subversion of an online trading community. Social Media+ Society, 9(2):20563051231177953, 2023.
- [King, 2019] Albert King. Akshare. https://github.com/ akfamily/akshare, 2019. Link
- [Kipf and Welling, 2016] Thomas N Kipf and Max Welling. Semi-supervised classification with graph convolutional networks. arXiv preprint arXiv:1609.02907, 2016.
- [Kuchler and Stroebel, 2021] Theresa Kuchler and Johannes Stroebel. Social finance. Annual Review of Financial Eco- nomics, 13(1):37-55, 2021.
- [Li et al., 2022] Ranran Li, Teng Han, and Xiao Song. Stock price index forecasting using a multiscale modelling strat- egy based on frequency components analysis and intelli- gent optimization. Applied Soft Computing, 124:109089, 2022.
- [Li et al., 2024] Tong Li, Zhaoyang Liu, Yanyan Shen, Xue Wang, Haokun Chen, and Sen Huang. Master: Market- guided stock transformer for stock price forecasting. In Proceedings of the AAAI Conference on Artificial Intelli- gence, volume 38, pages 162-170, 2024.
- [Lin et al., 2021] Hengxu Lin, Dong Zhou, Weiqing Liu, and Jiang Bian. Learning multiple stock trading patterns with temporal routing adaptor and optimal transport. In Pro- ceedings of the 27th ACM SIGKDD conference on knowl- edge discovery & data mining, pages 1017-1026, 2021.
- [Nelson et al., 2017] David MQ Nelson, Adriano CM Pereira, and Renato A De Oliveira. Stock market's price movement prediction with lstm neural networks. In 2017 International joint conference on neural networks (IJCNN), pages 1419-1426. Ieee, 2017.
- [Nti et al., 2020] Isaac Kofi Nti, Adebayo Felix Adekoya, and Benjamin Asubam Weyori. A systematic review of fundamental and technical analysis of stock market pre- dictions. Artificial Intelligence Review, 53(4):3007-3057, 2020.
- [Qian et al., 2024] Hao Qian, Hongting Zhou, Qian Zhao, Hao Chen, Hongxiang Yao, Jingwei Wang, Ziqi Liu, Fei Yu, Zhiqiang Zhang, and Jun Zhou. Mdgnn: Multi- relational dynamic graph neural network for comprehen- sive and dynamic stock investment prediction. In Proceed- ings of the AAAI Conference on Artificial Intelligence, vol- ume 38, pages 14642-14650, 2024.
- [Qin et al., 2017] Yao Qin, Dongjin Song, Haifeng Chen, Wei Cheng, Guofei Jiang, and Garrison Cottrell. A dual- stage attention-based recurrent neural network for time se- ries prediction. arXiv preprint arXiv:1704.02971, 2017.
- [Rokhsatyazdi et al., 2020] Ehsan Rokhsatyazdi, Shahryar Rahnamayan, Hossein Amirinia, and Sakib Ahmed. Opti- mizing lstm based network for forecasting stock market. In 2020 IEEE congress on evolutionary computation (CEC), pages 1-7. IEEE, 2020.
- [Rosenblatt, 1958] Frank Rosenblatt. The perceptron: a probabilistic model for information storage and organiza- tion in the brain. Psychological review, 65(6):386, 1958.
- [SVG, 2023] Annual report of shanghai airport author- ity. https://www.sse.com.cn/disclosure/listedinfo/ announcement/c/new/2024-03-30/600009 20240330 Link
- 179O.pdf, 2023. [tou, 2023] Analysis of china's tourism economic op- eration in 2023 and development forecast in 2024. https://www.mct.gov.cn/whzx/zsdw/zglyyjy/202402/ t20240205 951187.html, 2023. Link
- [Tra, 2023] China transportation industry development sta- tistical bulletin 2023. https://www.gov.cn/lianbo/bumen/ 202406/content 6957901.htm, 2023. Link
- [Vaswani, 2017] A Vaswani. Attention is all you need. Ad- vances in Neural Information Processing Systems, 2017.
- [Wang et al., 2012] Ju-Jie Wang, Jian-Zhou Wang, Zhe- George Zhang, and Shu-Po Guo. Stock index forecasting based on a hybrid model. Omega, 40(6):758-766, 2012.
- [Wang et al., 2021] Heyuan Wang, Shun Li, Tengjiao Wang, and Jiayi Zheng. Hierarchical adaptive temporal-relational modeling for stock trend prediction. In IJCAI, pages 3691- 3698, 2021. IJCAI
- [Wang et al., 2022] Yunong Wang, Yi Qu, and Zhensong Chen. Review of graph construction and graph learning in stock price prediction. Procedia Computer Science, 214:771-778, 2022.
- [Xia et al., 2024] Hongjie Xia, Huijie Ao, Long Li, Yu Liu, Sen Liu, Guangnan Ye, and Hongfeng Chai. Ci-sthpan: Pre-trained attention network for stock selection with channel-independent spatio-temporal hypergraph. In Pro- ceedings of the AAAI Conference on Artificial Intelligence, volume 38, pages 9187-9195, 2024.
- [Xu et al., 2021] Wentao Xu, Weiqing Liu, Lewen Wang, Yingce Xia, Jiang Bian, Jian Yin, and Tie-Yan Liu. Hist: A graph-based framework for stock trend forecast- ing via mining concept-oriented shared information. arXiv preprint arXiv:2110.13716, 2021.
- [Yin et al., 2021] Xingkun Yin, Da Yan, Abdullateef Almu- daifer, Sibo Yan, and Yang Zhou. Forecasting stock prices using stock correlation graph: A graph convolutional net- work approach. In 2021 International Joint Conference on Neural Networks (IJCNN), pages 1-8. IEEE, 2021.
- [Yu et al., 2017] Bing Yu, Haoteng Yin, and Zhanxing Zhu. Spatio-temporal graph convolutional networks: A deep learning framework for traffic forecasting. arXiv preprint arXiv:1709.04875, 2017. IJCAI
- [Zhang et al., 2017] Liheng Zhang, Charu Aggarwal, and Guo-Jun Qi. Stock price prediction via discovering multi- frequency trading patterns. In Proceedings of the 23rd ACM SIGKDD international conference on knowledge discovery and data mining, pages 2141-2149, 2017.
References were extracted automatically from the PDF and may contain errors.
Full text extracted automatically from the PDF; figures, tables and equations may differ. The PDF is the version of record.
1 Introduction
The stock market is a crucial component of the global economy and plays a vital role in the financial health and growth of economies around the world. It enables publicly traded companies to raise capital, allows individuals to make appropriate investment decisions, and facilitates the valuation of publicly traded companies. In order to achieve more accurate valuations and higher returns through investment, stock price forecasting has received increasing attention as a fundamental component of investment strategies [Xu et al., 2021].
Besides the conventional time-series approaches focusing on the internal dynamics within stocks to predict stock prices, modern approaches combine stock correlations to capture cross-stock influences [Cui et al., 2023; Qian et al., 2024]. The relationships between stocks are inherently graph-like, making graphs the most intuitive and scientifically appropriate choice as an information carrier. The most typical relation graphs are pre-defined static graphs [Qian et al., 2024] and data-driven correlation graphs [Yin et al., 2021]. However, the multifaceted and dynamic nature of stock relationships cannot be fully captured by these graphs.
* Corresponding authors
Code available on https://github.com/NingboSong/COGRASP.
We observe that the ability to exploit dynamic relations across different timescales and to integrate temporal features is key to achieving high forecasting performance. This entails significant challenges for both data sources and modeling. From the data perspective, it necessitates capturing diverse quantitative relationships among stocks. From the modeling perspective, it requires the capability to extract these relationships from relational graphs and leverage them across multiple timescales to enhance stock price predictions.
To address these challenges, we introduce COGRASP, which leverages the co-occurrence graph derived from online social media data to capture relational patterns. These patterns are then integrated with stock temporal features to predict stock dynamics across different timescales, with the final forecast achieved by fusing the forecasts from multiple timescales. Our contributions are summarized as follows:
- We examine the graph construction process within the context of stock investment prediction tasks, offering insights into modeling intricate stock relationships using co-occurrence graphs.
- We introduce COGRASP, an approach that overcomes the shortcomings in existing graph construction methods and integrates relational representation from cooccurrence graphs with temporal features to improve stock predictions by fusing predictions across different timescales.
- We conduct extensive experiments based on the relation graph extracted from social network posts and realworld open-source stock price datasets. Our evaluation shows COGRASP achieves significant performance improvements over the best-performed SOTA methods across four common evaluation metrics: Information Coefficient (IC, up to 39%), the Rank Information Coefficient (RankIC, up to 140%), the Information Ratio based IC (ICIR, up to 5%), and the Information Ratio based RankIC (RankICIR, up to 94%). Through extensive ablation studies, comparative experiments, and case analyses, we demonstrate that the performance of co-occurrence graphs surpasses that of concept graphs and correlation graphs. Moreover, co-occurrence graphs provide more comprehensive information with stronger
evidence of connections in real-world phenomena.
2 RelatedWork
2.1 StockMovement Prediction
Traditionally, historical price and trading data are used for predicting future stock prices, exploiting statistical models such as Autoregressive Integrated Moving Average [Adebiyi et al., 2014; Wang et al., 2012], conventional machine learning models like Support Vector Machines [Cao and Tay, 2001]. However, these methods exhibit limitations in feature extraction and poor performance in dealing with nonlinear data and time series data [Cui et al., 2023]. To address limitations in feature extraction, researchers are exploring analytical methods based on feature engineering to improve stock market forecast accuracy.
More specifically, time series data are analyzed and deconstructed to uncover key factors influencing stock price dynamics [Nti et al., 2020]. In these works, the underlying Dow Theory [Brown et al., 1998] classifies stock price dynamics into long-term, medium-term, and short-term categories. Such dynamics may align or conflict, making historical stock price data effectively a multi-frequency time series [Li et al., 2022].
In recent years, deep learning approaches, particularly Recurrent Neural Networks (RNNs), have gained prominence in stock prediction due to their effectiveness with time series data [Li et al., 2024]. Long Short-Term Memory networks (LSTMs) address the vanishing and exploding gradient issues of traditional RNNs with memory cells and gating mechanisms [Nelson et al., 2017; Chen et al., 2015]. Attentionbased LSTM models further improve prediction accuracy by weighting significant time steps [Qin et al., 2017]. LSTMs have shown superior performance over traditional technical analysis methods. However, selecting the appropriate time window size for RNNs is crucial, as it influences the model's ability to consider historical data. Many studies either fix the time window size [Feng et al., 2023] or determine it through experimentation or optimization techniques such as Genetic Algorithms [Qian et al., 2024; Huynh et al., 2023; Chung and Shin, 2018; Rokhsatyazdi et al., 2020]. This raises the question of whether a fixed time window can effectively capture multi-frequency information.
The State Frequency Memory network (SFM) [Hu and Qi, 2017; Zhang et al., 2017] addresses this by using the Discrete Fourier Transform to decompose LSTM hidden states into various frequencies. However, SFM still operates within a fixed time window, potentially limiting its ability to capture both high-frequency and low-frequency fluctuations in stock prices, which are valuable for comprehensive analysis.
2.2 Graph Construction in Stock Prediction
Besides studies on the dynamics of individual stocks, more recent approaches for improving prediction performance explore more effective relations between stocks. The most common approach is to construct graphs representing these relations, use GNNs to embed the relational information, and then feed these embeddings into a downstream predictor to forecast stock dynamics.[Wang et al., 2021]. Specifically, the relation graphs could be constructed based on one or more concepts such as the industry sector of stocks [Feng et al., 2019; Huynh et al., 2023], fund holding [Cui et al., 2023], financial investment fact [Chen et al., 2018b; Qian et al., 2024]. However, fixed and unweighted graphs often fail to comprehensively and accurately represent relationships and lack updating capability, necessitating additional methods for improvement.
Taking the data of the China Securities Depository and Clearing Corporation as an example, the number of retail investors is vast, with over 220 million retail investors in the Chinese A-share market, accounting for more than 70% of the market's total trading volume [Chi, 2024]. Retail investors are increasingly becoming a major force in the stock market. Their attention to stocks positively influences demand and subsequently impacts stock returns [Chen and Craig, 2023]. Meanwhile, with the development of information technology, retail investors have more platforms to receive information and comment on the stocks they invest in, serving as a space where they can exchange information and opinions. These stock forums not only facilitate discussions but also reveal investors' key focus areas, emotional shifts, and potential investment decisions. Considering growing evidence indicates that more direct forms of social interaction, such as conversation, affect investment decisions [Hirshleifer et al., 2024; Kuchler and Stroebel, 2021]. It has been observed that the behavior of retail investors exhibits a correlation with that of retail investors in nearby regions [Feng and Seasholes, 2004]. This dynamic has also been observed online [Chen et al., 2018a], one famous example is the "GameStop rescue" as led by members of the subreddit forum "WallStreetBets" in the early months of 2021 dramatically influenced the GameStop Corp's stock price [Just and Petersen, 2023]. Thus, by processing the news, reports and posts regarding stocks online, we may capture the representation of retail investors' attention on stocks and provide valuable information for better stock price prediction.
3 Preliminary
3.1 ProblemFormulation
Following the setup of existing works [Xia et al., 2024; Fan and Shen, 2024; Huynh et al., 2023], we formulate the stock price prediction problem into a stock relative price change prediction problem. We do not adopt the stock return ranking model because traders in the stock market can profit from various market dynamics through trading strategies such as going long, short selling, and selling options. The definitions of the notations are as follows.
Given set of stocks S = {s1, s2, ..., sn}. Each si ⊆ S has historical trading data on trading day t represented as the vector Xt si .
Given a graph G = (S, E,W), where E ⊆ S × S is the set of relations between stocks. W is the weight value assigned to each relation in E. We set a looking back windows T, our task in to use the relation graph G and the historical data of S during day t0 - T to t0, donated as Xt0-T,t0 S = {Xt0-k si |i = 1, 2, ..., n; k = T, T - 1...0}, to predict the relative price change of all stocks in S on the next trading day t0 + 1, donated as Y t0+1 S . Mathematically, this can be formalized as follows, where f is our prediction approach:
4 Methodology
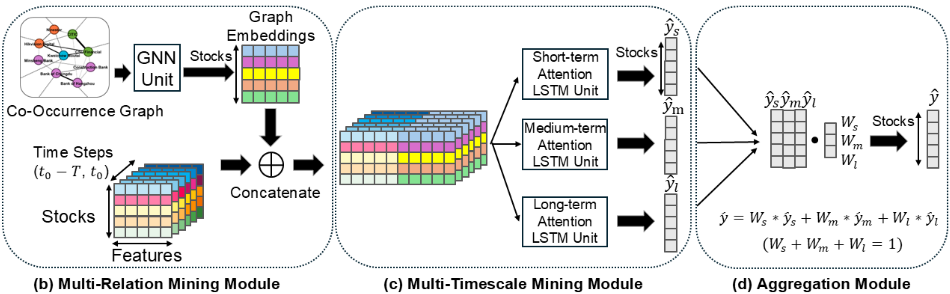
The overall structure of COGRASP is shown in Figure 1, which consists of three modules, namely the multi-relation mining module driven by a co-occurrence graph derived from online information such as reports, news, and posts; the multi-timescale mining module composed of three timeseries prediction models, and the aggregation module that combines the predictions of the three timescales for more accurate stock price forecasting in a weighted aggregation way.
4.1 Multi-RelationMiningModule
Graph Construction: As mentioned, the existing GNNbased stock price prediction methods employ fixed graphs based on specific concepts such as industry sector affiliation to construct the graph. However, this kind of concept graph has several significant drawbacks.
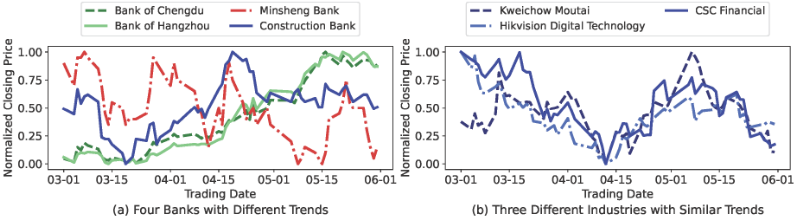
- D1: Concept graphs are inefficient. Even within the same concept, the relation strengths between stocks are not uniform; some stocks are highly correlated, while others have weak or negligible relations. As illustrated in the Figure 2 (a), four stocks within the banking sector display divergent dynamics.
- D2: Concept graphs are incomplete. Concepts, such as industry sector, are typically pre-defined and fixed
and with high cost to build comprehensive graphs manually, making them inherently incomplete and inflexible. In the Figure 2 (b), three stocks display highly similar price trajectories despite belonging to disparate industries. Conventional concept graphs fail to capture this relation information.
- D3: Concept graphs are indiscriminate Many studies process the fixed graphs as unweighted and assume the stocks have the same influence on the other stocks, which is not a proper assumption [Wang et al., 2022].
- D4: Concept graphs are rigid. Some concepts are fixed (industry sector), 6-monthly (fund holding) updated, or even longer [Qian et al., 2024]. However, the stock market is changing rapidly, and without a corresponding graph to represent the relations, the accuracy of the predictions will be greatly compromised.
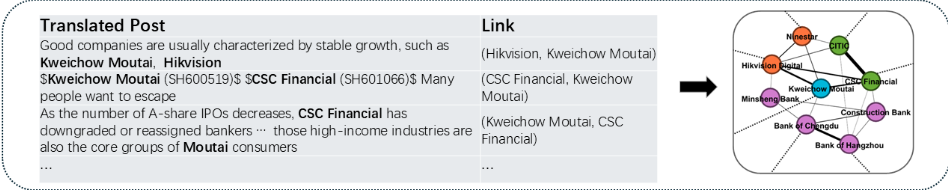
To address these challenges, we propose constructing a cooccurrence graph based on information extracted from various online sources. As illustrated in the Figure 1 (a), this graph is derived from resources user-generated content such as posts, news articles, or reports. A link between two stocks is established whenever they are co-mentioned within the same piece of content. The weight of each link corresponds to the frequency of such co-mentions across social media platforms. The rationales are as follows:
- Capturing cross-concept relation information (D1): On social media, retail investors frequently discuss market hotspots, significant events, and the dynamics of publicly traded companies. These discussions often reveal cross-concept relational information. By analyzing
these posts, we can capture the relationships between stocks across various concepts, such as industries and fund holdings, thereby addressing the limitations of constructing graphs solely based on pre-defined concepts.
- Importance of retail investors' attention on social media (D2): As mentioned, the increasing number of retail investors and their substantial trading volumes now significantly influence short-term stock prices. Social media provides these investors with a platform to share and discuss investment ideas, covering diverse topics such as breaking news, industry trends, and economic factors. These discussions often reveal connections that are not captured by static relational graphs.
- Discriminate the relation strength between stocks (D3): In the stock market, the relation strength between different stocks varies. By analyzing the discussion frequency in forum posts, we can more accurately identify which stocks have stronger relations and which have weaker or no relations. Based on actual market discussions, this graph construction method not only indicates the relation between stocks but also weighs the relation strength, reflecting the differences in relation intensity.
- Customized updating frequency (D4): Due to the realtime nature of social networks, we can update our graph at any desired frequency. Therefore, the update frequency is not constrained by the periodic release of public information but can be determined by the specific requirements of the prediction goal.
In summary, by utilizing a co-occurrence graph, we can more comprehensively capture the complex relations in the stock market, thereby improving the accuracy of stock price prediction though the performance is highly related to the online information quality. The Figure 1 (a) illustrates the example of extracting stock co-occurrence from forum posts, namely counting the co-occurrence frequency between stocks.
Graph Neural Network (GNN) Unit: By using the cooccurrence graph derived from online posts, GNNs can embed the intricate relations between stocks, capturing how they influence each other. A widely used baseline GNN model is the Graph Convolutional Network (GCN), which utilizes symmetric-normalized aggregation and a self-loop update approach, as defined below [Kipf and Welling, 2016; Hamilton, 2020].
where ∑v∈N(u)∪u hv √|N(u)||N(v)| is the symmetric normalized aggregation operation based upon the degrees of the nodes involved. ˆW (k) are trainable parameter matrices and σ denotes an element-wise non-linearity (e.g., ReLU). We build the GCN using the Chebyshev Spectral Graph Convolutional Operator [Defferrard et al., 2016] with ReLU activation function to embed the relation representation between stocks as shown on the Figure 1 (b). Compared with the most commonly used graph convolutional operator GCN [Kipf and Welling, 2016], it can capture the higher order information since it models indirect and multi-hop relationships effectively.
As previously mentioned, relationships have distinct lifespans. For instance, the effects of event-driven relations (e.g., earnings reports and production reforms) typically diminish over time, whereas the influence of policy tends to persist longer. Rather than forcefully fitting dynamic relations using attention mechanisms, a more rational approach is to enable the model to discern the strength of relations across different timescales and integrate them with temporal features. Since relations evolve over time and influence stock prices with varying intensities, rather than stock price changes simultaneously creating new relationships, the model should capture this dynamic. GCN units can effectively represent these relationships as embeddings, so the final output of the multi-relation mining module should be the temporal features concatenated with the graph embeddings derived from the cooccurrence graph. This combination allows the subsequent multi-timescale mining module to learn the impact of relationships across different timescales, enhancing prediction accuracy.
4.2 Multi-Timescale MiningModule
To increase the ability of the approach to extract multitimescale information from temporal and relation embeddings data, we propose a Multi-Timescale Mining module as shown in the Figure 1 (c). This module integrates three attention-based long short-term memory (ALSTM) units [Qin et al., 2017] with different time steps, specifically designed to capture long-term (e.g., half-monthly), medium-term (e.g., ten-day), and short-term (e.g., weekly) dynamics. By simultaneously capturing multi-timescale and dynamically adjusting their respective weights through an adaptive mechanism, the Multi-Timescale Mining module enables more reliable and accurate stock price predictions. In detail, We first generate Xt0-s,t0 S , Xt0-m,t0 S , Xt0-l,t0 S from Xt0-T ,t0 S , s,m, l represent the time steps about short-term, medium-term, and long-term. We construct three ALSTM units with different time steps (s, m, l), and use the Attention mechanism in each module to calculate the weighted sum of the hidden states ˜h. In short-term ALSTM unit, we input Xt0-s,t0 S to a LSTM and get output hidden state sequence Hs = {hs1 , hs2 , ..., hss },then use the attention mechanism to calculate the attention weights αti and the weighted sum ˜ ys : eti = tanh(Whhsti +bh), αti = exp(eti ) ∑st=i αthst , ˆ ys = ∑st=1 αthst . The other two hidden state sequences ˆ ys , ˆ ym, and ˆ yl can be obtained by applying the same calculations to both the medium and long-term units.
4.3 AggregationModule
The Aggregation Module combines the outputs of the three ALSTM units using weighted aggregation. Technically, this can be realized by three learnable weight parameters, denoted as ws, wm, wl under the constrain ws +wm+wl = 1, to produce the final prediction output across multi-timescale forecasts as shown on the Figure 1 (d):
5 Experiments and Results
In this section, we study our approach with comprehensive experiments, aiming to answer the research questions:
- RQ1: How does our proposed approach perform compared with the state-of-the-art methods?
- RQ2: How is the effect of different modules in our approach?
- RQ3: Whether the co-occurrence graph can capture more relations than conventional relation-based graphs as discussed, and derives better prediction performance?
5.1 Experimental Setting
Datesets: The China Securities Index 300 (CSI 300) is a capitalization-weighted index representing the top 300 stocks in the Chinese A-share market, reflecting general market trends [Hou and Li, 2014]. Snowball (xueqiu.com) is a major Chinese investment social media platform with around 40 million registered users, aggregating retail investors in Ashares. We collected over 300,000 posts on Snowball, spanning October 2023 to February 2024. By analyzing stock mentions, we constructed a co-occurrence graph. Stock features, including opening price, closing price, highest price, lowest price, trading volume, trading value, amplitude, price change percentage, price change amount, and turnover rate, trading volume, were sourced from the open-source dataset AKShare [King, 2019]. Training and validation used data from January 2015 to February 2024, and testing used data from March to June 2024.
Implementation Details: Experiments are based on PyTorch and PyG. All models were trained for 500 rounds, and an early stopping mechanism of 20 rounds was introduced to prevent overfitting. The lookback window was set to 15, the learning rate was set to 0.001, and an L2 regularization of 0.001 was applied. During the training process, the ReduceLROnPlateau strategy was used to dynamically adjust the learning rate. In the COGRASP, the time scales were set to 5, 10, 15. The number of layers of the GCN was set to 1 layer and the number of hidden units was 16. For each ALSTM unit, the number of layers was 1, and the number of hidden units was set to 64. In addition, each model was repeated 5 times to verify its stability, and the average performance was reported.
Baselines: We compared the performance of COGRASP with several stock price prediction models: (1) MLP [Rosenblatt, 1958]: Classic multi-layer feedforward neural network. (2) XGBoost [Chen and Guestrin, 2016]: A decisiontree based method. (3) LSTM [Hochreiter and Schmidhuber, 1997]: Specialized recurrent neural network that can capture long-term dependencies. (4) ALSTM [Qin et al., 2017]: Attention-based LSTM model that enhances predictive power by integrating attention mechanisms. (5) Transformer [Vaswani, 2017]: Deep learning architecture based on self-attention mechanisms. (6) HIST [Xu et al., 2021]: Explores relations between stocks using predefined concepts. (7) STGCN [Yu et al., 2017]: Captures both temporal and spatial features by leveraging GCN. (8) SFM [Zhang et al., 2017]: Decomposes the hidden states of LSTM memory units into multiple frequency components to simulate the various underlying trading patterns behind stock price fluctuations. (9) StockMixer [Fan and Shen, 2024]: Devises the time mixing to exchange multi-scale time patch information. (10) MDGNN* [Qian et al., 2024]: Uses a dynamic graph to capture the relations between stocks, and then employs a Transformer to process temporal data. The authors did not release the model as open source, and its use of private data makes reproduction impossible. Consequently, we relied directly on the performance metrics reported in the original paper.
Metrics: Following [Li et al., 2024], we employ four IC and its variants metrics which are widely accepted in stock price prediction research [Lin et al., 2021]: IC, RankIC, ICIR, and RankICIR. IC represents the Pearson correlation coefficient and is calculated daily to assess the linear relationship between predicted and actual values. RankIC uses the Spearman rank correlation coefficient to evaluate the monotonic relationship between predictions and actual outcomes. ICIR normalizes the IC by dividing it by its standard deviation, providing a measure of the consistency and reliability of the IC. RankICIR Enhances the RankIC by normalizing it against its standard deviation, thereby offering an assessment of the RankIC's consistency and reliability over time.
5.2 Performance Comparison (RQ1)
In Table 1, we compare COGRASP with the baseline methods, where COGRASP consistently outperforms across all evaluation metrics. We also discover that SFM demonstrates its superiority over LSTM, ALSTM, and Transformer by identifying different frequencies to better capture multi-period dynamic information, suggesting that leveraging multi-frequency information from historical stock data can significantly enhance stock price prediction capabilities. Furthermore, while HIST and STGCN aim to improve predictive accuracy by analyzing inter-stock relations, they rely on pre-defined and fixed graph structures, which may not effectively represent the complex interrelations among stocks in the market, leading to their underperformance compared to COGRASP. While MDGNN accounts for the extraction of multi-concept relationships among stocks, its Temporal Extraction Layer does not consider the multi-scale performance of stocks, leading to less satisfactory results. These results collectively substantiate the efficiency of COGRASP's integrated multi-relation and multi-timescale mining capabilities in enhancing the performance of stock price prediction.
| Model | IC | RankIC | ICIR | RankICIR |
|---|---|---|---|---|
| MLP | 0.0116 | 0.0003 | 0.0315 | 0.0149 |
| XGBoost | 0.0269 | 0.0031 | 0.1341 | 0.0125 |
| LSTM | 0.0306 | 0.0224 | 0.1375 | 0.1096 |
| ALSTM | 0.0227 | 0.0236 | 0.1301 | 0.0844 |
| Transformer | 0.0203 | 0.0232 | 0.1477 | 0.1271 |
| HIST | 0.0153 | 0.0213 | 0.1341 | 0.1011 |
| STGCN | 0.0062 | 0.0039 | 0.1519 | 0.0802 |
| SFM | 0.0297 | 0.0194 | 0.1594 | 0.1289 |
| StockMixer | 0.0394 | 0.0270 | 0.1428 | 0.1139 |
| MDGNN* | 0.0322 | - | 0.2488 | - |
| COGRASP | 0.0546 | 0.0647 | 0.2600 | 0.2507 |
5.3 Ablation Study (RQ2)
| Variant | IC | RankIC | ICIR | RankICIR |
|---|---|---|---|---|
| w. | 0.0227 | 0.0236 | 0.1301 | 0.0844 |
| w.T | 0.0241 | 0.0231 | 0.1643 | 0.0817 |
| w.TA | 0.0357 | 0.0355 | 0.1879 | 0.1371 |
| w.R | 0.0384 | 0.0389 | 0.2065 | 0.1686 |
| w.RT | 0.0507 | 0.0586 | 0.2450 | 0.2462 |
| COGRASP | 0.0546 | 0.0647 | 0.2600 | 0.2507 |
To validate the effectiveness of each component, we conducted ablation experiments, by creating variants below:
- w.: A single ALSTM to process time series data.
- w.T: Multi-Timescale Mining Module only.
- w.R: Incorporates the Multi-Relation Mining Module and utilizes a single ALSTM to process both time series data and graph-embedded information.
- w.TA: With Multi-Timescale Mining Module and Aggregation Module.
- w.RT: With Multi-Relation Mining module and MultiTimescale Mining Module.
We observed that as the number of components included in each variant increased, the performance of the variants progressively improved, providing evidence for the positive impact of each component.
| Statistic | Industry | Corr. | Co-Oc. |
|---|---|---|---|
| Number of nodes | 300 | 300 | 300 |
| Number of components | 63 | 1 | 1 |
| Density | 0.03 | 1 | 0.34 |
| Avg. degree | 7.49 | 91.90 | 106.28 |
| Avg. closeness centrality | 0.03 | 1 | 0.61 |
| Model | STGCN | COGRASP | ||||
|---|---|---|---|---|---|---|
| Graph | Industry | Corr. | Co-Oc. | Industry | Corr. | Co-Oc. |
| IC | 0.0062 | 0.0069 | 0.0075 | 0.0379 | 0.0406 | 0.0546 |
| RankIC | 0.0039 | 0.0058 | 0.0078 | 0.0266 | 0.0378 | 0.0647 |
| ICIR | 0.1519 | 0.1329 | 0.1581 | 0.1792 | 0.2030 | 0.2600 |
| RankICIR | 0.0802 | 0.0932 | 0.1030 | 0.1622 | 0.1585 | 0.2507 |
5.4 Network Analyse (RQ3)
To assess the effectiveness of our graph construction, we performed network analysis and comparative experiments. In the absence of standardized data on fund holdings or investment relations, we compared our method against the widely used industry sector graph.
Graph Structure and Statistics: Table 3 compares the conventional industry sector graph, correlation graph, and our cooccurrence graph. Compared to the industry sector graph, the co-occurrence graph contains significantly more information between stocks but is not as over-densely connected as a correlation graph, where every pair of nodes is linked. A single connected component indicates that stocks are in a giant interconnected structure, with more frequent and diverse relations between stocks. Additionally, the significantly higher closeness centrality further suggests that the co-occurrence graph more comprehensively captures the relations between stocks within the market. In contrast, the industry sector graph's dispersed structure and lower connectivity result in a relatively limited amount of contained information while the correlation graph is over-connected reducing the reliability of the influence between stocks.
| Stock | Link No. | Relation | Stock | Link No. | Relation |
|---|---|---|---|---|---|
| Tourism Group Duty Free | 123 | Business Partner | Daqin Railway | 34 | Competitor |
| Southern Airlines | 72 | Client | Shanghai Port | 20 | Same Location |
| Eastern Airlines | 60 | Client | Jin-Jiang Hotels | 19 | Related Industry |
| Hainan Airport | 59 | Same Industry | Yangtze Power | 11 | Same Ownership |
| Air China | 54 | Client | Railway Construction | 8 | Competitor |
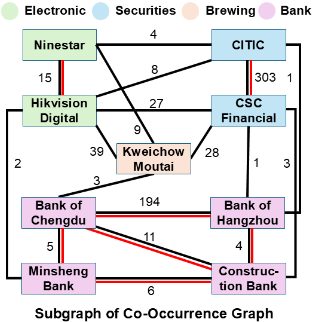
To avoid visual clutter from displaying all 300 stocks, we selected 9 stocks from 4 different industries to create subgraphs that highlight the distinctions as shown in Figure 3. Unlike the subgraph of the industry sector graph, our new graph has stronger connectivity since there is only one component consistent with the 3. While the weights reflect the relations between stocks. For instance, the Bank of Chengdu and the Bank of Hangzhou are more frequently mentioned together than the other two banks, which is consistent with their stock dynamics as shown on the left side of Figure 2. Similarly, the comparable stock dynamics of Kweichow Moutai, CSC Financial, and Hikvision, as shown on the right side of Figure 2 , are also captured by our graph due to the strong connections between them. From these two comparisons, we can infer that our graph can more accurately include the relations between stocks, even when there is no strong industry sector relation or predefined concepts.
Performance Comparison: In Table 4, we applied both STGCN and our COGRASP to compare the prediction performance of the industry sector graph, correlation graph, and the co-occurrence graph. The results demonstrate that the cooccurrence graph consistently outperforms across all evaluated metrics and models.
Case Study: To further investigate the concepts of connection in our graph captured from online posts, a case study of Shanghai Airport (symbol: SH600009) was applied. Table 5 lists the ten stocks most frequently connected to it in the co-occurrence graph. Tourism Group Duty-Free appears as the top connected stock due to Shanghai Airport's significant reliance on rent from duty-free shops at the airport [CTG, 2023]. The three airlines-China Eastern Airlines, China Southern Airlines, and Air China-are crucial clients [SVG, 2023]. Additionally, both Hainan Airport and Shanghai Airport are noted as the only airport sector stocks, highlighting their industry relevance. Daqin Railway, China Railway Construction, and Shanghai Port, as alternative transportation options, both compete with and collaborate with the air transport industry, affecting Shanghai Airport[Tra, 2023]. Meanwhile, Yangtze Power and Jin-Jiang Hotels are connected due to their impact from broader economic policies and the travel industry, respectively [tou, 2023].
In summary, the analysis above illustrates that the cooccurrence graph captures a range of relations within the stock market that cannot be easily categorized under a single concept. And the performance comparison demonstrates the effectiveness of our co-occurrence graph. Compared to traditional concept and correlation graphs, leveraging such a comprehensive and reasonable stock relation graph should result in more accurate stock price forecasting.
6 Discussion
The above experiments demonstrate the effectiveness of our method, but it's not without any limitations. A key issue is the uncontrollable quality of the input data. While this problem may be mitigated by using large volumes of data, it cannot be completely eliminated. Therefore, we may need the interpretation method to assess the reliability of its predictions. In real-world stock investment, deep learning-driven trading systems face skepticism due to their "black box" nature, which lacks transparency. This opacity raises concerns about predictability and decision-making, limiting broader acceptance. Improving explainability could boost trust, address regulatory and ethical concerns, and promote wider adoption of these systems in financial markets Our developed COGRASP approach has made initial progress in model explainability. By a co-occurrence graph, the embedded information in this graph can reveal potential factors influencing stock price movements (similar to Figure 1 (b)). Moreover, in the Multi-Timescale Mining Module, the ALSTM units with an attention mechanism, allow the weight distribution to indicate the influence of different historical points on stock price movements. Lastly, the Aggregation Module explains how factors across different time scales cumulatively affect stock price predictions through its weight distribution. Despite these advancements, there remains potential for further enhancing the explainability of the COGRASP to reveal the key relational subgraphs and significant temporal features that the model relies on for its decision-making.
7 Conclusion
In this paper, we propose a new approach for stock price forecasting. Our approach features a stock relation module driven by a co-occurrence graph derived from online information such as reports, newspapers, and social media. Besides, we proposed a multi-timescale aggregation module composed of three ALSTMmodels across multiple timescales (i.e., long-, medium-, and short-term) to capture multi-timescale trends and an aggregation module that combines the predictions of multi-timescale trends for more accurate stock price forecasting in a weighted aggregation way. With real-world opensource stock market data, we validate the effectiveness of our approach through comprehensive experiments and the efficiency of our co-occurrence graph through quantitative and qualitative analysis. Future work will focus on incorporating explainable AI methods to enhance the explainability of our model's predictions as mentioned in the discussion.
Acknowledgments
The work has been partially supported by the Programme for Project-Related Personal Exchange (PPP) DAAD-RGC Germany - Hong Kong Joint Research Scheme (Grant No. 57654792).
@inproceedings{ijcai2025p837,
  title     = {COGRASP: Co-Occurrence Graph Based Stock Price Forecasting},
  author    = {Li, Zhengze and Song, Zilin and Yuan, Tingting and Fu, Xiaoming},
  booktitle = {Proceedings of the Thirty-Fourth International Joint Conference on
               Artificial Intelligence, {IJCAI-25}},
  publisher = {International Joint Conferences on Artificial Intelligence Organization},
  editor    = {James Kwok},
  pages     = {7527--7535},
  year      = {2025},
  month     = {8},
  note      = {Main Track},
  doi       = {10.24963/ijcai.2025/837},
  url       = {https://doi.org/10.24963/ijcai.2025/837},
}
TY - CPAPER TI - COGRASP: Co-Occurrence Graph Based Stock Price Forecasting AU - Li, Zhengze AU - Song, Zilin AU - Yuan, Tingting AU - Fu, Xiaoming T2 - Proceedings of the Thirty-Fourth International Joint Conference on Artificial Intelligence, IJCAI-25 PB - International Joint Conferences on Artificial Intelligence Organization PY - 2025 SP - 7527 EP - 7535 DO - 10.24963/ijcai.2025/837 UR - https://doi.org/10.24963/ijcai.2025/837 ER -Copied
Machine-readable versions of this paper, for tools and AI agents:





