
KnowMDD: Knowledge-guided Cross Contrastive Learning for Major Depressive Disorder Diagnosis
Proceedings of the Thirty-Fourth International Joint Conference on Artificial Intelligence. Main Track. Pages 7536-7544.
https://doi.org/10.24963/ijcai.2025/838
Keywords
- Humans and AI: HAI: Brain sciences
- Machine Learning: ML: Multi-view learning
- Multidisciplinary Topics and Applications: MTA: Health and medicine
- Machine Learning: ML: Representation learning
Abstract
Major Depressive Disorder (MDD) is a prevalent and severe mental disease. Functional Magnetic Resonance Imaging (fMRI)-based diagnostic methods, which analyze Functional Connectivity (FC) to identify abnormal functional connections, have shown promise as biomarker-based approaches for diagnosing depression. However, the high costs of fMRI data result in small sample sizes, hindering the effective identification of abnormal FC patterns. Moreover, existing methods often overlook the potential benefits of incorporating domain knowledge into their models. In this paper, we propose KnowMDD, a novel knowledge-guided cross contrastive learning framework for MDD diagnosis. By incorporating domain knowledge and employing data augmentation, KnowMDD addresses data sparsity while improving robustness and interpretability. Specifically, multiple atlases are used to construct complementary brain graph representations. The default mode network, closely associated with depression, is introduced into the contrastive learning paradigm for diverse subgraph augmentations, while an attention mechanism captures global semantic relationships between brain regions. Based on them, a cross contrastive learning is designed to learn robust representations for accurate diagnosis. Extensive experiments demonstrate the effectiveness, robustness, and interpretability of KnowMDD, which outperforms state-of-the-art methods. We also develop a demonstration system to show its practical application.
- [Brown and Hamarneh, 2016] Colin J Brown and Ghassan Hamarneh. Machine learning on human connectome data from mri. arXiv preprint arXiv:1611.08699, 2016.
- [Buckner et al., 2008] Randy L Buckner, Jessica R Andrews-Hanna, and Daniel L Schacter. The brain's default network: anatomy, function, and relevance to disease. Annals of the new York Academy of Sciences, 1124(1):1-38, 2008.
- [Chu et al., 2022] Ying Chu, Guangyu Wang, Liang Cao, Lishan Qiao, and Mingxia Liu. Multi-scale graph repre- sentation learning for autism identification with functional mri. Frontiers in Neuroinformatics, 15:802305, 2022.
- [Craddock et al., 2012] R Cameron Craddock, G Andrew James, Paul E Holtzheimer III, Xiaoping P Hu, and He- len S Mayberg. A whole brain fmri atlas generated via spa- tially constrained spectral clustering. Human brain map- ping, 33(8):1914-1928, 2012.
- [Cui et al., 2023] Weigang Cui, Mingyi Sun, Qunxi Dong, Yuzhu Guo, Xiao-Feng Liao, and Yang Li. A multiview sparse dynamic graph convolution-based region-attention feature fusion network for major depressive disorder de- tection. IEEE Transactions on Computational Social Sys- tems, 2023.
- [Drysdale et al., 2017] Andrew T Drysdale, Logan Grosenick, Jonathan Downar, Katharine Dunlop, Farrokh Mansouri, Yue Meng, Robert N Fetcho, Benjamin Zebley, Desmond J Oathes, Amit Etkin, et al. Resting-state con- nectivity biomarkers define neurophysiological subtypes of depression. Nature medicine, 23(1):28-38, 2017.
- [Du et al., 2018] Yuhui Du, Zening Fu, and Vince D Cal- houn. Classification and prediction of brain disorders us- ing functional connectivity: promising but challenging. Frontiers in neuroscience, 12:525, 2018.
- [Epalle et al., 2021] Thomas Martial Epalle, Yuqing Song, Zhe Liu, and Hu Lu. Multi-atlas classification of autism spectrum disorder with hinge loss trained deep architectures: Abide i results. Applied soft computing, 107:107375, 2021.
- [Hamilton et al., 2015] J Paul Hamilton, Madison Farmer, Phoebe Fogelman, and Ian H Gotlib. Depressive rumi- nation, the default-mode network, and the dark matter of clinical neuroscience. Biological psychiatry, 78(4):224- 230, 2015.
- [Ji et al., 2021] Junzhong Ji, Zhihui Chen, and Cuicui Yang. Convolutional neural network with sparse strategies to classify dynamic functional connectivity. IEEE Journal of Biomedical and Health Informatics, 26(3):1219-1228, 2021.
- [Jiang et al., 2020] Hao Jiang, Peng Cao, Mingyi Xu, Jinzhu Yang, and Osmar Zaiane. Hi-gcn: A hierarchical graph convolution network for graph embedding learning of brain network and brain disorders prediction. Computers in Biology and Medicine, 127:104096, 2020.
- [Kam et al., 2019] Tae-Eui Kam, Han Zhang, Zhicheng Jiao, and Dinggang Shen. Deep learning of static and dynamic brain functional networks for early mci detection. IEEE transactions on medical imaging, 39(2):478-487, 2019.
- [Kawahara et al., 2017] Jeremy Kawahara, Colin J Brown, Steven P Miller, Brian G Booth, Vann Chau, Ruth E Grunau, Jill G Zwicker, and Ghassan Hamarneh. Brain- netcnn: Convolutional neural networks for brain net- works; towards predicting neurodevelopment. NeuroIm- age, 146:1038-1049, 2017.
- [Kennedy et al., 1998] David N Kennedy, Nicholas Lange, Nikos Makris, Julianna Bates, James Meyer, and Verne S Caviness Jr. Gyri of the human neocortex: an mri-based analysis of volume and variance. Cerebral Cortex (New York, NY: 1991), 8(4):372-384, 1998.
- [Kim et al., 2021] Byung-Hoon Kim, Jong Chul Ye, and Jae- Jin Kim. Learning dynamic graph representation of brain connectome with spatio-temporal attention. Advances in Neural Information Processing Systems, 34:4314-4327, 2021.
- [Lee et al., 2024] Deok-Joong Lee, Dong-Hee Shin, Young- Han Son, Ji-Wung Han, Ji-Hye Oh, Da-Hyun Kim, Ji- Hoon Jeong, and Tae-Eui Kam. Spectral graph neural network-based multi-atlas brain network fusion for major depressive disorder diagnosis. IEEE Journal of Biomedi- cal and Health Informatics, 2024.
- [Li et al., 2019] Weikai Li, Limei Zhang, Lishan Qiao, and Dinggang Shen. Toward a better estimation of functional brain network for mild cognitive impairment identifica- tion: a transfer learning view. IEEE journal of biomedical and health informatics, 24(4):1160-1168, 2019.
- [Li et al., 2021a] Chao Li, Yiran Wei, Xi Chen, and Carola- Bibiane Schönlieb. Brainnetgan: Data augmentation of brain connectivity using generative adversarial network for dementia classification. In Deep Generative Mod- els, and Data Augmentation, Labelling, and Imperfec- tions: First Workshop, DGM4MICCAI 2021, and First Workshop, DALI 2021, Held in Conjunction with MICCAI 2021, Strasbourg, France, October 1, 2021, Proceedings 1, pages 103-111. Springer, 2021.
- [Li et al., 2021b] Zezhi Li, Meihua Ruan, Jun Chen, and Yiru Fang. Major depressive disorder: advances in neu- roscience research and translational applications. Neuro- science bulletin, 37:863-880, 2021.
- [Li et al., 2024] Tongtong Li, Yuhui Guo, Ziyang Zhao, Miao Chen, Qiang Lin, Xiping Hu, Zhijun Yao, and Bin Hu. Automated diagnosis of major depressive disorder with multi-modal mris based on contrastive learning: a few-shot study. IEEE Transactions on Neural Systems and Rehabilitation Engineering, 2024.
- [Liu et al., 2023] Lingwen Liu, Guangqi Wen, Peng Cao, Tianshun Hong, Jinzhu Yang, Xizhe Zhang, and Osmar R Zaiane. Braintgl: A dynamic graph representation learning model for brain network analysis. Computers in Biology and Medicine, 153:106521, 2023.
- [Meszlényi et al., 2017] Regina J Meszlényi, Krisztian Buza, and Zoltán Vidnyánszky. Resting state fmri functional connectivity-based classification using a convolutional neural network architecture. Frontiers in neuroinformatics, 11:61, 2017.
- [Noman et al., 2024] Fuad Noman, Chee-Ming Ting, Hak- mook Kang, Raphaël C-W Phan, and Hernando Ombao. Graph autoencoders for embedding learning in brain net- works and major depressive disorder identification. IEEE Journal of Biomedical and Health Informatics, 2024.
- [Oh et al., 2023] Ji-Hye Oh, Deok-Joong Lee, Chang-Hoon Ji, Dong-Hee Shin, Ji-Wung Han, Young-Han Son, and Tae-Eui Kam. Graph-based conditional generative adver- sarial networks for major depressive disorder diagnosis with synthetic functional brain network generation. IEEE Journal of Biomedical and Health Informatics, 2023.
- [Rolls et al., 2020] Edmund T Rolls, Chu-Chung Huang, Ching-Po Lin, Jianfeng Feng, and Marc Joliot. Automated anatomical labelling atlas 3. Neuroimage, 206:116189, 2020.
- [Stoyanov et al., 2022] Drozdstoy Stoyanov, Vladimir Khorev, Rositsa Paunova, Sevdalina Kandilarova, Denitsa Simeonova, Artem Badarin, Alexander Hramov, and Semen Kurkin. Resting-state functional connectivity impairment in patients with major depressive episode. International Journal of Environmental Research and Public Health, 19(21):14045, 2022.
- [WHO, 2017] World Health Organization. (2017) Depres- sion and other common mental disorders: global health estimates., 2017.
- [WHO, 2023] World Health Organization. (2023) Depres- sive Disorder (Depression)., 2023.
- [Woo et al., 2017] Choong-Wan Woo, Luke J Chang, Mar- tin A Lindquist, and Tor D Wager. Building better biomarkers: brain models in translational neuroimaging. Nature neuroscience, 20(3):365-377, 2017.
- [Yan et al., 2019] Chao-Gan Yan, Xiao Chen, Le Li, Fran- cisco Xavier Castellanos, Tong-Jian Bai, Qi-Jing Bo, Jun Cao, Guan-Mao Chen, Ning-Xuan Chen, Wei Chen, et al. Reduced default mode network functional connec- tivity in patients with recurrent major depressive disor- der. Proceedings of the National Academy of Sciences, 116(18):9078-9083, 2019.
- [Yao et al., 2021] Dongren Yao, Jing Sui, Mingliang Wang, Erkun Yang, Yeerfan Jiaerken, Na Luo, Pew-Thian Yap, Mingxia Liu, and Dinggang Shen. A mutual multi-scale triplet graph convolutional network for classification of brain disorders using functional or structural connectivity. IEEE transactions on medical imaging, 40(4):1279-1289, 2021.
- [Yasin et al., 2021] Sana Yasin, Syed Asad Hussain, Sinem Aslan, Imran Raza, Muhammad Muzammel, and Alice Othmani. Eeg based major depressive disorder and bipolar disorder detection using neural networks: A review. Com- puter Methods and Programs in Biomedicine, 202:106007, 2021.
- [Zhang et al., 2023] Mengda Zhang, Dan Long, Zhaoqing Chen, Chunhao Fang, You Li, Pinpin Huang, Fengnong Chen, and Hongwei Sun. Multi-view graph network learn- ing framework for identification of major depressive dis- order. Computers in Biology and Medicine, 166:107478, 2023.
- [Zhao et al., 2020] Jianlong Zhao, Jinjie Huang, Dongmei Zhi, Weizheng Yan, Xiaohong Ma, Xiao Yang, Xianbin Li, Qing Ke, Tianzi Jiang, Vince D Calhoun, et al. Func- tional network connectivity (fnc)-based generative adver- sarial network (gan) and its applications in classification of mental disorders. Journal of neuroscience methods, 341:108756, 2020.
- [Zhu et al., 2022] Jing Zhu, Changting Jiang, Junhao Chen, Xiangbin Lin, Ruilan Yu, Xiaowei Li, and Bin Hu. Eeg based depression recognition using improved graph con- volutional neural network. Computers in Biology and Medicine, 148:105815, 2022.
References were extracted automatically from the PDF and may contain errors.
Full text extracted automatically from the PDF; figures, tables and equations may differ. The PDF is the version of record.
1 Introduction
Major Depressive Disorder (MDD) has become a prevalent and serious mental disease, characterized by decreased energy and interest, persistent sadness, and even suicidal ideation, plans, and attempts [Li et al., 2021b]. According to the World Health Organization (WHO) statistics reports, over 300 million people worldwide are affected by MDD [WHO, 2017]. In 2023, more than 75% of patients in low and middle income countries remain untreated [WHO, 2023]. Thus, it is necessary to identify and diagnose MDD in a timely manner.
∗Corresponding author.
The diagnosis of depression can be categorized into subjective and non-subjective methods. Clinically, MDD diagnosis primarily relies on subjective evaluation by doctors or standardized tools [Yasin et al., 2021], such as the Patient Health Questionnaire (PHQ-9) and the Hamilton Depression Scale (HAMD). However, subjective methods have notable disadvantages, that patients may under-report their symptoms and mental state [Zhu et al., 2022] due to phenomena like "social masking". This may significantly increase the risk of misdiagnosis or missed diagnosis. In contrast, non-subjective diagnostic methods for MDD, such as electroencephalogram (EEG), magnetic resonance imaging (MRI), and heart rate variability (HRV) analysis, aim to identify MDD by analyzing the data derived from these technologies. Among them, functional Magnetic Resonance Imaging (fMRI) has attracted lots of attention due to its non-invasive characteristics and superior spatial resolution.
In the diagnosis of MDD, fMRI is a valuable tool to analyze brain activity and connectivity. By employing brain atlases to partition the brain into Regions of Interests (ROIs), fMRI measures Blood Oxygen Level Dependent (BOLD) signal fluctuations to infer functional connectivity (FC) relationships [Li et al., 2019; Ji et al., 2021]. FC has emerged as an effective biomarker to identify MDD [Drysdale et al., 2017; Zhang et al., 2023; Liu et al., 2023; Cui et al., 2023]. Studies have shown that MDD patients present reduced FC between the precuneus, superior occipital gyrus, and other ROIs [Stoyanov et al., 2022]. Moreover, specific brain networks, like the Default Mode Network (DMN) and the Central Execution Network (CEN), show significant FC alterations among MDD patients [Yan et al., 2019].
Motivation 1: Sample sparsity of fMRI data. The high cost of fMRI data acquisition leads to small sample sizes of most datasets, hindering the ability of traditional methods due to insufficient data. A critical question thus arises: How can we effectively address data sparsity while capturing abnormal functional connectivity in MDD? To tackle this issue, several artificial intelligence-based methods have been developed. Some methods adopt multiple brain atlases to model brain regions and utilize Graph Neural Networks (GNNs) to learn robust representations of brain networks [Yao et al., 2021; Lee et al., 2024]. Others employ self-supervised learning approaches, such as generative adversarial networks, autoencoders, and contrastive learning, to augment data and enhance their learning abilities [Oh et al., 2023; Noman et al., 2024; Li et al., 2024].
Motivation 2: Incorporation of domain knowledge. Existing models often overlook the potential benefits of incorporating domain knowledge into the model. In neuroscience, MDD studies frequently focus on the DMN, a largescale brain network primarily comprising the dorsal medial prefrontal cortex, posterior cingulate cortex, precuneus, and angular gyrus [Buckner et al., 2008]. Previous studies [Yan et al., 2019] have shown that self-focused rumination of MDD, characterized by excessive focus and repetitive negative thinking, is closely associated with the DMN [Hamilton et al., 2015]. This raises a question: Can incorporating the DMN-specific knowledge into model design better capture neural activity patterns underlying self-focused rumination? With the strong correlation between the DMN and depression, we argue that incorporating this knowledge could improve the understanding and diagnosis of MDD.
To address these challenges, we propose a knowledgeguided cross contrastive learning framework (KnowMDD) for MDD diagnosis, which adopts contrastive learning augmentation to alleviate data sparsity and introduces domainspecific knowledge into the framework to enhance both learning ability and interpretability. The framework leverages multiple brain atlases and multimodal information to construct multi-view brain graph representations. Within these graph views, the DMN is incorporated into the contrastive learning paradigm to generate diverse subgraph views for data augmentation while preserving core functional representations. Additionally, an attention mechanism is employed to learn global semantic relationship between ROIs. Finally, a cross contrastive learning strategy is utilized to learn robust representations, facilitating accurate and robust MDD diagnosis.
The main contributions of this paper are as follows:
- We propose KnowMDD, a novel framework for MDD diagnosis. This framework can accurately infer MDD status while addressing data sparsity and effectively leveraging domain knowledge.
- We design an effective cross contrastive learning-based method, which utilizes multiple brain atlases to construct brain graphs and augments graph views while preserving MDD-specific knowledge, enabling the learning of meaningful and robust representations.
- Extensive experiments validate the effectiveness, superiority, robustness, and interpretability of our KnowMDD. All the data and code are publicly available in the following repository 1 . We also develop a demonstration system to show its practical application.
2 RelatedWork
Machine learning techniques have been widely applied to the MDD diagnosis, using abnormal FCs as biomarkers for rapid and automatic classification. Traditional methods, such as Support Vector Machines [Woo et al., 2017], Logistic Regression [Brown and Hamarneh, 2016], and Linear Discriminant Analysis [Du et al., 2018], have been employed to capture resting-state FC features, enabling hierarchical feature representations from connectome data. Upon the development in image and object classification, convolutional neural networks (CNNs) have also been used in functional network modeling, e.g. BrainNetCNN [Kawahara et al., 2017] and various CNN-based models exploring abnormal FC states in brain disorders [Meszl´enyi et al., 2017; Kam et al., 2019]. However, due to the irregularity, node disorder, and heterogeneous adjacency characteristics of brain networks, deep learning models often fail to capture the intricate topological and spatial information in these networks.
1 https://github.com/ZJUDataIntelligence/KnowMDD
In the past years, GNNs have shown promise in capturing structural information within brain networks. For instance, a hierarchical graph feature embedding method was proposed to consider both individual brain networks and global networks [Jiang et al., 2020]. The STAGIN model leverages spatiotemporal attention mechanisms to learn dynamic brain connectome graphs [Kim et al., 2021]. Another approach introduced a multi-scale graph convolutional network that utilizes a multi-atlas framework to co-train graph convolutional modules [Yao et al., 2021]. Additionally, a multi-atlas fusion method was developed for early and late fusion, combining intra-atlas and inter-atlas relation features [Lee et al., 2024]. Despite these advancements, due to the small sample size of public datasets, most of these methods demonstrate high task dependence and insufficient generalization ability, limiting their broader applicability.
Recently, self-supervised learning methods have been proposed for MDD diagnosis, leveraging their generalization capabilities. For example, the GAE-based model [Noman et al., 2024] and the GC-GAN [Oh et al., 2023] have been proposed to learn topological and functional connectivity patterns. Graph contrastive learning (GCL), by constructing positive and negative sample pairs, has shown effectiveness in capturing high-level representations with strong robustness and generalization. Popular methods include MGCLACO [Zhang et al., 2023], which captures spatial similarity through adaptive channel optimization and contrastive learning (CL), and multi-modal CL-based method [Li et al., 2024], which integrates multi-modal data to extract heterogeneous features. However, these work have paid limited effort to explore the potential of domain knowledge in the model design. In this work, we aim to leverage multi-atlas to generate multiple graph views, and employ contrastive learning to augment graph views while introducing domain-specific knowledge in the view augmentation process to generate diverse subgraph views for robust representation learning.
3 Method
In this section, we propose a knowledge-guided cross contrastive learning framework for MDD diagnosis, as shown in Figure 1. First, we construct the brain functional graph leveraging multiple brain atlases and multimodal information. Second, we design a knowledge-guided contrastive learning to capture global semantic relationships using an at-
(a) Multi-atlas-based Brain Functional Graph Construction
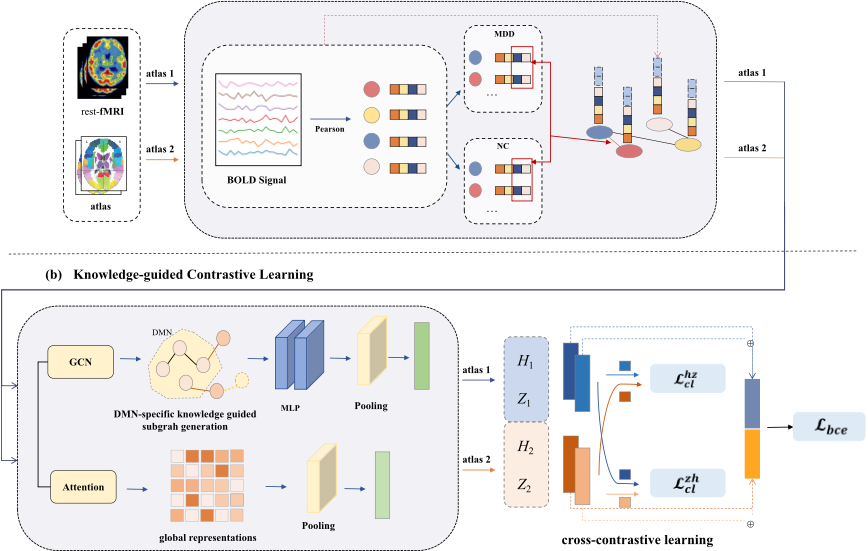

tention mechanism and augment core graph views through incorporating domain-specific knowledge. After that, a cross contrastive learning strategy is adopted to learn the final robust representations.
3.1 Multi-atlas-based Brain Functional Graph Construction
Brain atlases, e.g. AAL [Rolls et al., 2020], Harvard [Kennedy et al., 1998] and Craddock [Craddock et al., 2012], segment the brain into distinct ROIs based on functional or structural perspectives, as shown in Figure 2. Different atlases may offer complementary representations of specific areas or networks. Here, we adopt two atlases, denoted as M1 and M2, to generate robust graph representations.
Each preprocessed fMRI dataset is associated with these atlases, dividing the brain into N m ROIs. FC is modeled as an undirected graph Gm = (V m,Em), where nodes correspond to atlas-defined ROIs. Voxel-level BOLD signals within ROIs are averaged to obtain the mean BOLD sequence Bm ∈ RN m×T . For the n-th ROI, the mean BOLD signal is denoted as Bm n = [b1, b2, . . . , bT ]⊤, where T is the total number of time points in the fMRI scan. FC is determined by measuring the temporal correlation between the BOLD time series of ROIs. Two ROIs are considered functionally connected if their oxygen consumption patterns are temporally synchronized. The strength of FC is quantified by the Pearson correlation coefficient between their respective time series.
The construction of brain functional graphs is illustrated in Figure 3. The FC matrix FC m ∈ RN m×N m is derived by the Pearson correlation coefficient, where each element F C m i,j represents the FC strength between the i-th and j-th ROIs. To identify abnormal connectivity patterns in MDD, a paired t-test is performed to compare FC between normal controls (NC) and MDD, calculating the p-value for each ROI pair. Connections with a p-value below a predefined threshold (e.g. 0.05) are considered significantly different, indicating the potential abnormal FC in MDD.
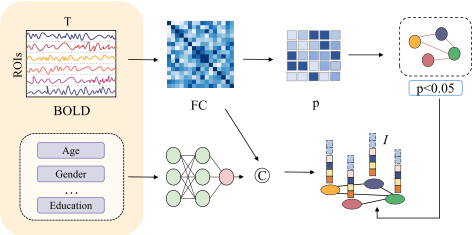
Additionally, to address the clinical and pathological heterogeneity across individuals, demographic information such as age, gender, and other omics data is encoded into a feature vector I ⊆ R1×d , where d represents the dimensionality of pathological features. By merging the correlation coefficients FCm with pathological features I, we construct integrated node features X ⊆ RN m×(N m+d) as shown in Equation 1. To ensure a consistent dimensionality D across graph node features, we use a multi-layer perceptron (MLP) to obtain the node features Hm ⊆ RN m×D .
Thus, we construct multiple graphs, denoted as [G1 ,G2 ], and fuse multimodal information to augment graph representations and improve the robustness of downstream analysis.
3.2 Knowledge-guided Contrastive Learning
KnowMDD leverages the functional relevance of DMN and constructs functional subgraphs. By integrating global semantic relationships and core graph features with domainspecific knowledge, KnowMDD effectively learns the representations of abnormal brain connectivity patterns.
A self-attention module is introduced to model the varying contribution of ROIs to FC patterns. the FCm is linearly projected to obtain the query (Q), key (K), and value (V ) matrices, as defined in Equation 2, Where, WQ,WK,WV ∈ RD×D′ are learnable parameter matrices, where D′ is the projected feature dimension.
The attention weight matrix and the resulting output of the attention module are calculated as shown in Equation 3.
A global mean pooling operation is then applied to aggregate the feature representations as described in Equation 4.
Subsequently, domain knowledge is utilized to guide the identification and extraction of a biologically-based subgraph. To be specific, we employ a Graph Convolutional Network (GCN) to encode the graph Gm and capture the potential functional abnormal relationships. The functional graph integrates abnormal FC features through multiple GCN layers, with the feature update formula expressed in Equation 5.
Here, A˜ is the adjacency matrix without self-loops, D˜ is the degree matrix, K(l) m represents the node features at the l-th layer, Xm is the initial node features, W (l+1) is the learnable weight matrix, and σ(·) is the non-linear activation function.
Informed by the established association between the DMN and MDD, ROIs within the DMN and those functionally connected counterparts are selected as core subgraphs. During random walk encoding, the initial set of DMN nodes V m DMN is designated as the starting nodes, and the transition probability matrix is defined in Equation 6.
Here, eai,j represents the connection between nodes i and j, and Am(i) denotes the adjacency matrix for node i. The random walk paths are represented as R = {v1, v2, ...vk, }, where v1 ⊆ V m DMN , and k is the random walk step length. Multiple random paths are generated from V m DMN to generate the core subgraph Gmsub . An MLP and a pooling layer are then applied to extract knowledge-guided subgraph features, as denoted in Equation 7.
By capturing global semantic relationships and integrating biologically meaningful DMN subgraph embeddings, the patient's features under the same atlas [hm, zm] are derived as described in Equation 7 and Equation 3.
Cross-contrastive learning is leveraged to construct multiview, multi-atlas contrastive objectives, capture consistent discriminative features across atlases, and reduce data noise and sample scarcity. In a dataset with S patients, the fMRI data of the i-th patient generates embedding pairs from two atlases, denoted as si = [hi1 , zi1 , hi2 , zi2 ], where hi1 and hi2 are subgraph encoded features, and zi1 and zi2 are attention encoded features. In KnowMDD, features from the same patient across atlases are treated as positive pairs (e.g. [hi1 , zi2 ] and [hi2 , zi1 ]), whereas features from different patients (e.g. [hi1 , zj2 ], i ̸= j) are treated as negative pairs. The contrastive learning losses for these pair are defined in Equation 8 and Equation 9.
| Method | Acc | Sen | Spec | F1 |
|---|---|---|---|---|
| SSGAN [Zhao et al., 2020] | 65.16±4.41 | 68.15±7.96 | 61.90±6.15 | 66.96±5.03 |
| GAE-FCNN [Noman et al., 2024] | 65.07±5.56 | 69.74±9.09 | 60.00±7.16 | 67.29±6.22 |
| WGAN GP [Li et al., 2021a] | 65.12±3.91 | 67.58±6.82 | 62.44±5.51 | 66.79±4.56 |
| GC-GAN [Oh et al., 2023] | 66.84±4.25 | 70.24±7.89 | 63.14±8.35 | 68.72±4.57 |
| GCN | 64.53±2.20 | 75.00±4.07 | 52.80±4.31 | 63.69±2.26 |
| MGRL [Chu et al., 2022] | 64.01±3.11 | 63.92±6.35 | 64.13±6.97 | 64.82±3.66 |
| MISO-DNN [Epalle et al., 2021] | 65.92±3.69 | 63.04±14.06 | 69.06±12.55 | 65.00±7.85 |
| MMTGCN [Yao et al., 2021] | 66.87±3.15 | 68.19±9.82 | 65.4±5.02 | 67.88±6.43 |
| Lee's model [Lee et al., 2024] | 69.59±3.15 | 68.99±7.72 | 70.21±4.31 | 70.07±4.72 |
| KnowMDD-AAL&Harvard | 74.39±1.95 | 79.19±10.46 | 69.54±12.52 | 73.88±1.71 |
| KnowMDD-AAL&Craddock | 73.26±1.57 | 76.07±10.09 | 70.74±9.61 | 72.93±1.60 |
| KnowMDD-Harvard&Craddock | 74.57±3.13 | 78.87±7.319 | 69.50±10.35 | 74.06±3.26 |
Here, sim(·) denotes the cosine similarity between two embedding vectors. τ is a temperature hyperparameter that controls the smoothness of the similarity distribution. The final loss function is defined in Equation 10, where Lbce denotes the binary classification loss, and λ is a balancing weight. During training, the parameters of encoders, subgraph projection and predictors are iteratively updated to minimize L.
4 Experimental Results
4.1 Experimental Settings
Datasets. The rs-fMRI data used in this study are obtained from the multi-site public dataset, Rest-meta-MDD [Yan et al., 2019]. We chose the dataset from Site 20 with the largest number of depression samples, with 282 MDD/251 NC.
Implementation. The model is optimized using the Adam optimizer with a batch size of 32, a learning rate of 0.0001, and a dropout rate of 0.2. In the contrastive loss computation, the temperature coefficient is fixed at 0.6. In the total loss function, the weight ratio λ is set to 0.25. Three brain atlases are utilized: the AAL [Rolls et al., 2020] atlas with 116 ROIs, the Harvard [Kennedy et al., 1998] atlas with 112 ROIs, and the Craddock [Craddock et al., 2012] atlas with 200 ROIs. Evaluation Metrics. The experiment employs 5-fold crossvalidation and uses accuracy (Acc), sensitivity (Sen), specificity (Spec), and F1 score (F1) for performance evaluation. Baselines. We consider 9 baselines for comparison, categorized as follows: (a) 4 self-supervised learning methods, including SSGAN [Zhao et al., 2020], GAE-FCNN [Noman et al., 2024], WGAN-GP [Li et al., 2021a] and GC-GAN [Oh et al., 2023]; and (b) 5 graph learning methods based on multi-atlas, including the GCN model, MGRL [Chu et al., 2022], MISO-DNN [Epalle et al., 2021], MMTGCN [Yao et al., 2021] and Lee's model [Lee et al., 2024].
4.2 Baseline Comparison
The experimental results are presented in Table 1. We observe that KnowMDD demonstrates superior performance across all evaluation metrics, particularly in sensitivity. This improvement is attributed to the multi-atlas cross-contrastive learning framework, which leverages domain knowledge and global semantic relationships. KnowMDD can capture the deep features and alleviate the limitations of single-atlas perspectives. Additionally, KnowMDD shows strong performance in multi-atlas fusion experiments, with the combination of Harvard and Craddock atlases achieving the best performance. This demonstrates the effectiveness of combining multi-atlas graph learning and self-supervised learning to address the challenges of limited data samples. Meanwhile, KnowMDD excels in sensitivity but its improvement in specificity is comparatively modest. This may be due to the addition of contrastive learning, which makes the model more focused on abnormal functional connectivity features, thereby enhancing its sensitivity but limiting specificity gains.
4.3 Ablation Study
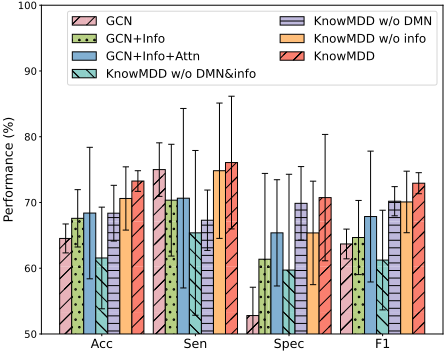
To evaluate the contribution of each component, we conduct an ablation study on KnowMDD and its variants. Six variants are compared: GCN uses GCNs to encode and concatenate features from two atlases, GCN+Info adds the patient pathological information as node features, GCN+Info+Attn introduces an attention mechanism, KnowMDD-DMN&Info excludes both DMN-based subgraph generation and pathological information, KnowMDD-DMN removes the DMNbased subgraph generation, and KnowMDD-Info excludes the pathological information. As shown in Figure 4, each component effectively improves MDD diagnosis. Adding patient information to GCN improves 3.06% accuracy, while its removal from KnowMDD leads to a 3.8% decrease, highlighting the importance of clinical heterogeneity. Excluding the DMN subgraph sampling module also decreases accuracy. Notably, when both domain knowledge components are removed, KnowMDD performs worse than GCN, demonstrating the significant value of domain knowledge.
4.4 Robustness Study
To further evaluate the robustness and generalizability of KnowMDD, we conduct experiments on data from three other sites with the next largest sample sizes (Site 1, 21, and 25), including 74 MDD/74 NC, 86 MDD/70 NC, and 89 MDD/63 NC, respectively. As shown in Table 2, results demonstrate KnowMDD's robustness and effectiveness across datasets from diverse sources, validating its generalizability.
| Site 1 | ||||
|---|---|---|---|---|
| Method | Acc | Sen | Spec | F1 |
| MGRL | 62.87±6.55 | 66.43±6.69 | 60.88±11.91 | 62.66±6.51 |
| MISO-DNN | 64.21±7.86 | 53.70±38.58 | 66.98±36.59 | 53.55±16.54 |
| MMTGCN | 60.83±7.97 | 58.24±15.47 | 67.56±19.58 | 60.50±7.98 |
| Lee's model | 60.73±11.56 | 59.47±14.02 | 61.94±16.64 | 60.09±12.04 |
| KnowMDD-A&H | 66.97±7.13 | 56.93±7.67 | 79.55±16.84 | 66.53±7.34 |
| KnowMDD-A&C | 64.25±5.05 | 69.85±10.41 | 58.55±9.23 | 63.55±4.86 |
| KnowMDD-H&C | 64.92±8.91 | 68.96±10.57 | 60.74±7.96 | 64.51±8.98 |
| Site 21 | ||||
| Method | Acc | Sen | Spec | F1 |
| MGRL | 63.81±2.99 | 75.50±14.27 | 50.81±13.37 | 61.41±2.32 |
| MISO-DNN | 64.54±10.11 | 76.54±18.14 | 50.04±6.05 | 62.47±9.20 |
| MMTGCN | 62.83±8.62 | 70.58±15.79 | 57.31±16.15 | 62.09±9.48 |
| Lee's model | 63.61±9.46 | 63.13±12.77 | 64.31±11.07 | 63.17±9.79 |
| KnowMDD-A&H | 64.58±7.93 | 83.16±4.29 | 37.94±12.26 | 59.62±9.06 |
| KnowMDD-A&C | 68.41±6.91 | 71.05±11.52 | 64.72±6.25 | 72.17±6.72 |
| KnowMDD-H&C | 68.39±10.00 | 70.65±13.65 | 65.38±8.08 | 67.86±9.95 |
| Site 25 | ||||
| Method | Acc | Sen | Spec | F1 |
| MGRL | 65.18±8.83 | 86.93±7.45 | 36.97±19.64 | 58.97±11.31 |
| MISO-DNN | 60.83±7.97 | 58.24±15.47 | 67.56±19.58 | 60.50±7.98 |
| MMTGCN | 64.11±6.17 | 78.76±11.09 | 46.49±8.84 | 61.87±7.22 |
| Lee's model | 63.87±9.28 | 66.84±8.92 | 59.72±16.69 | 68.48±6.21 |
| KnowMDD-A&H | 67.10±4.71 | 66.64±8.98 | 68.05±11.28 | 70.17±3.87 |
| KnowMDD-A&C | 67.72±10.04 | 76.16±16.65 | 56.23±12.89 | 65.59±9.74 |
| KnowMDD-H&C | 68.47±16.75 | 93.74±7.74 | 37.57±26.79 | 61.72±20.83 |
4.5 Transferability Study
We further evaluate the transferability of KnowMDD by directly applying the model trained on Site 20 to datasets from Site 21 and Site 25, which having different data distribution. From Table 3, KnowMDD achieves accuracies of 64.10% and 67.11% on datasets with different population distributions. This strong performance is attributed to the integration of pathological information and contrastive learning, which significantly mitigates noise in small datasets and demonstrates adaptability to heterogeneous populations.
| Sites | Atlas | Acc | Sen | Spec | F1 |
|---|---|---|---|---|---|
| AAL&Harvard | 64.10 | 74.42 | 51.43 | 62.91 | |
| S21 | AAL&Craddock | 63.46 | 73.26 | 51.43 | 62.33 |
| Harvard&Craddock | 64.10 | 60.47 | 68.57 | 64.08 | |
| S25 | AAL&Harvard | 67.11 | 84.27 | 42.86 | 63.46 |
| AAL&Craddock | 67.11 | 79.78 | 49.21 | 64.66 | |
| Harvard&Craddock | 65.13 | 50.56 | 85.71 | 65.01 |
4.6 Hyperparameters Analysis
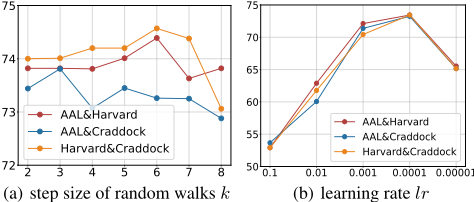
We analyze the impact of hyperparameters in KnowMDD, including the step size of random walks k and learning rate lr. We vary k from 2 to 8, with the results shown in Figure 5(a). Results reveal that the optimal k differs across atlas fusions: k = 6 for AAL&Harvard and Harvard&Craddock, while k = 3 for AAL&Craddock. Similarly, the learning rate lr is analyzed by different values, as shown in Figure 5(b). The results indicate that the highest accuracy is achieved when lr = 0.001. Increasing the lr to 0.01 or decreasing it to 0.0001 leads to a significant decline in performance.
4.7 Discussion
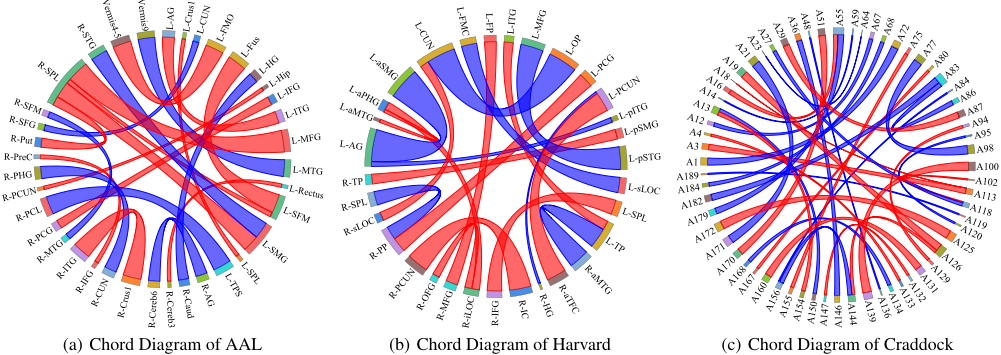
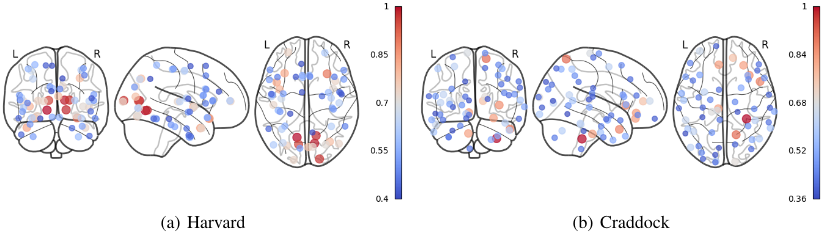
Significance analysis of ROIs in DMN. Analyzing FC differences between individuals with MDD and NC is critical for identifying potential biomarkers for MDD diagnosis. Using the AAL, Harvard, and Craddock atlases, we compare FC differences between ROIs with higher p-values, as shown in Figure 6. The chord diagram highlights significant FC differences, with numerous arcs connecting DMN ROIs to other regions, indicating the DMN's importance in MDD diagnosis. ROIs such as PCUN, Angular, and PHG in the AAL atlas, as well as L-AG, R-AG, L-apPHG, and L-aMTG in the Harvard atlas, show strong connections. These findings suggest MDD is characterized by abnormal FC within the DMN, especially in regions related to memory, emotion regulation, and self-reflection (e.g., PCUN, Angular, PHG, and MTG). Significance analysis of attention module. We visualize the top 20% ROIs with the highest attention weights in the Harvard&Craddoc atlases, as shown in Figure 7. Compared to the FC changes in Figure 2, the attention module assigns higher weights to most abnormal connections, revealing the varying functional significance of brain regions in depression. Besides, differences in activation patterns are observed between the left and right hemispheres. Certain areas exhibit symmetric activation, while others show asymmetry, potentially reflecting brain functional lateralization. These findings underscore the critical role of the attention mechanism.
4.8 Demonstration System
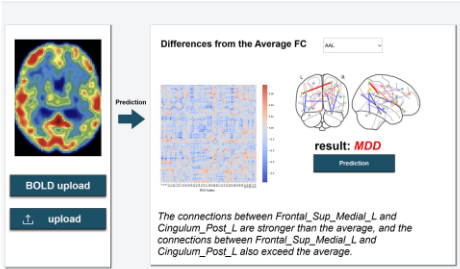
To explore KnowMDD's usability, we develop a demonstration system for MDD diagnosis, as shown in Figure 8. Users can upload fMRI data via the "upload" button and process BOLD sequences via the "BOLD upload" button. By clicking the "Prediction" button and selecting an atlas from the dropdown menu, users can view FC differences between the patient and the average of NC, along with the final prediction result and a detailed diagnostic analysis. This system has been trialed in local hospitals as a diagnostic reference tool.
5 Conclusion
In this paper, we propose a novel method KnowMDD for major depressive disorder diagnosis. This is a knowledge-guided cross-contrastive learning model that employ contrastive learning paradigm incorporating domain-specific knowledge, to alleviate data sparsity and improve robustness and interpretability. Multiple atlases are used for multi-view graph representation learning. By embedding domain-specific knowledge, multimodal information is used to alleviate clinical heterogeneity, and the DMN is incorporated into the contrastive learning paradigm to generate diverse subgraph views for data augmentation. KnowMDD offers a more scientifically grounded MDD diagnosis. Extensive experiments demonstrate the effectiveness, robustness, and interpretability of our method. We also develop a demonstration system to show the practical application, making a promising step toward the real-world deployment of accurate and reliable MDD diagnostic tools.
Acknowledgments
This work was supported by the National Key Research and Development Program of China (No.2024YDLN0005), the "Pioneer" and "Leading Goose" R&D Program of Zhejiang (No.2025C02068), the Natural Science Foundation of Zhejiang Province (No.LTGG24F020002, LY24F020013), the National Natural Science Foundation of China (No.62102349, 82401786), and the Scientific Research Cultivation Fund of Hangzhou City University (No.J-202404). The authors would like to acknowledge the Supercomputing Center of Hangzhou City University, for the support of advanced computing resources, and the Nanhu Brain-Computer Interface Institute for their valuable support and collaboration.
@inproceedings{ijcai2025p838,
  title     = {KnowMDD: Knowledge-guided Cross Contrastive Learning for Major Depressive Disorder Diagnosis},
  author    = {Lin, Anchen and Wang, Weikun and Han, Haijun and Zhu, Fanwei and Ma, Qi and Zheng, Zengwei and Zhou, Binbin},
  booktitle = {Proceedings of the Thirty-Fourth International Joint Conference on
               Artificial Intelligence, {IJCAI-25}},
  publisher = {International Joint Conferences on Artificial Intelligence Organization},
  editor    = {James Kwok},
  pages     = {7536--7544},
  year      = {2025},
  month     = {8},
  note      = {Main Track},
  doi       = {10.24963/ijcai.2025/838},
  url       = {https://doi.org/10.24963/ijcai.2025/838},
}
TY - CPAPER TI - KnowMDD: Knowledge-guided Cross Contrastive Learning for Major Depressive Disorder Diagnosis AU - Lin, Anchen AU - Wang, Weikun AU - Han, Haijun AU - Zhu, Fanwei AU - Ma, Qi AU - Zheng, Zengwei AU - Zhou, Binbin T2 - Proceedings of the Thirty-Fourth International Joint Conference on Artificial Intelligence, IJCAI-25 PB - International Joint Conferences on Artificial Intelligence Organization PY - 2025 SP - 7536 EP - 7544 DO - 10.24963/ijcai.2025/838 UR - https://doi.org/10.24963/ijcai.2025/838 ER -Copied
Machine-readable versions of this paper, for tools and AI agents:





