
Disentangled and Personalized Representation Learning for Next Point-of-Interest Recommendation
Proceedings of the Thirty-Fourth International Joint Conference on Artificial Intelligence. Main Track. Pages 7697-7705.
https://doi.org/10.24963/ijcai.2025/856
Keywords
- Multidisciplinary Topics and Applications: MTA: Transportation
Abstract
Next POInt-of-Interest (POI) recommendation predicts a user's next move and facilitates location-based services such as navigation and travel planning. SOTA methods fuse each POI and its contexts (e.g., time, category, and region) into a single representation to model sequential user movement. This hinders the effective utilization of context information, and diverse user preferences are also neglected. To tackle these limitations, we propose Disentangled and Personalized Representation Learning (DPRL) as a novel method for next POI recommendation. DPRL decouples POIs and contexts during representation learning, capturing their sequential regularities independently using separate recurrent neural networks (RNNs). To model the preference of each user, DPRL adopts an aggregation mechanism that integrates dynamic user preferences and spatial-temporal factors into the learned representations. We compare DPRL with 16 state-of-the-art baselines. The results show that DPRL outperforms all baselines and achieves an average accuracy improvement of 10.53% over the best-performing baseline.
- [Deng et al., 2024] Bangchao Deng, Bingqing Qu, Pengyang Wang, and Dingqi Yang. REPLAY: mod- eling time-varying temporal regularities of human mobility for location prediction over sparse trajectories. CoRR, abs/2402.16310, 2024.
- [Duan et al., 2023] Chenghua Duan, Wei Fan, Wei Zhou, Hu Liu, and Junhao Wen. Clsprec: Contrastive learning of long and short-term preferences for next poi recommenda- tion. In CIKM, pages 473-482, 2023.
- [Feng et al., 2015] Shanshan Feng, Xutao Li, Yifeng Zeng, Gao Cong, Yeow Meng Chee, and Quan Yuan. Personal- ized ranking metric embedding for next new POI recom- mendation. In IJCAI, pages 2069-2075, 2015. IJCAI
- [Feng et al., 2018] Jie Feng, Yong Li, Chao Zhang, Funing Sun, Fanchao Meng, Ang Guo, and Depeng Jin. Deep- move: Predicting human mobility with attentional recur- rent networks. In WWW, pages 1459-1468, 2018.
- [Feng et al., 2024] Shanshan Feng, Feiyu Meng, Lisi Chen, Shuo Shang, and Yew Soon Ong. ROTAN: A rotation- based temporal attention network for time-specific next POI recommendation. In SIGKDD, pages 759-770, 2024.
- [He et al., 2020] Xiangnan He, Kuan Deng, Xiang Wang, Yan Li, Yong-Dong Zhang, and Meng Wang. Lightgcn: Simplifying and powering graph convolution network for recommendation. In SIGIR, pages 639-648, 2020.
- [Lai et al., 2024] Yantong Lai, Yijun Su, Lingwei Wei, Tianqi He, Haitao Wang, Gaode Chen, Daren Zha, Qiang Liu, and Xingxing Wang. Disentangled contrastive hyper- graph learning for next POI recommendation. In SIGIR, pages 1452-1462, 2024.
- [Li et al., 2021] Ke Li, Xuan Rao, Xiaobing Pang, Lisi Chen, and Siqi Fan. Route search and planning: A survey. Big Data Res., page 100246, 2021.
- [Lian et al., 2020] Defu Lian, Yongji Wu, Yong Ge, Xing Xie, and Enhong Chen. Geography-aware sequential lo- cation recommendation. In SIGKDD, 2020.
- [Lin et al., 2017] Tsung-Yi Lin, Priya Goyal, Ross B. Gir- shick, Kaiming He, and Piotr Dollár. Focal loss for dense object detection. In ICCV, pages 2999-3007, 2017.
- [Liu et al., 2016] Qiang Liu, Shu Wu, Liang Wang, and Tie- niu Tan. Predicting the next location: A recurrent model with spatial and temporal contexts. In AAAI, pages 194- 200, 2016.
- [Luo et al., 2021] Yingtao Luo, Qiang Liu, and Zhaocheng Liu. STAN: spatio-temporal attention network for next location recommendation. In WWW, pages 2177-2185, 2021.
- [Luo et al., 2023] Yan Luo, Haoyi Duan, Ye Liu, and Fu-Lai Chung. Timestamps as prompts for geography-aware loca- tion recommendation. In CIKM, pages 1697-1706, 2023.
- [MacQueen and others, 1967] James MacQueen et al. Some methods for classification and analysis of multivariate ob- servations. In Proceedings of the fifth Berkeley sympo- sium on mathematical statistics and probability, volume 1, pages 281-297.
- [Qin et al., 2023] Yifang Qin, Hongjun Wu, Wei Ju, Xiao Luo, and Ming Zhang. A diffusion model for poi recom- mendation. ToIS, 2023.
- [Rao et al., 2022] Xuan Rao, Lisi Chen, Yong Liu, Shuo Shang, Bin Yao, and Peng Han. Graph-flashback network for next location recommendation. In SIGKDD, pages 1463-1471, 2022.
- [Rao et al., 2024] Xuan Rao, Renhe Jiang, Shuo Shang, Lisi Chen, Peng Han, Bin Yao, and Panos Kalnis. Next point- of-interest recommendation with adaptive graph con- trastive learning. TKDE, 2024.
- [Rao et al., 2025a] Xuan Rao, Shuo Shang, Renhe Jiang, Lisi Chen, and Peng Han. Traffic forecasting with patch- based graph convolutional recurrent network. GeoInfor- matica, pages 1-30, 2025.
- [Rao et al., 2025b] Xuan Rao, Shuo Shang, Renhe Jiang, Peng Han, and Lisi Chen. Seed: Bridging sequence and diffusion models for road trajectory generation. In Pro- ceedings of the ACM on Web Conference 2025, pages 2007-2017, 2025.
- [Sun et al., 2019] Zhiqing Sun, Zhi-Hong Deng, Jian-Yun Nie, and Jian Tang. Rotate: Knowledge graph embedding by relational rotation in complex space. In ICLR, 2019.
- [Sun et al., 2020] Ke Sun, Tieyun Qian, Tong Chen, Yile Liang, Quoc Viet Hung Nguyen, and Hongzhi Yin. Where to go next: Modeling long-and short-term user pref- erences for point-of-interest recommendation. In AAAI, pages 214-221, 2020.
- [Sun et al., 2024] Tianao Sun, Ke Fu, Weiming Huang, Kai Zhao, Yongshun Gong, and Meng Chen. Going where, by whom, and at what time: Next location prediction consid- ering user preference and temporal regularity. In SIGKDD, pages 2784-2793, 2024.
- [Vaswani et al., 2017] Ashish Vaswani, Noam Shazeer, Niki Parmar, Jakob Uszkoreit, Llion Jones, Aidan N. Gomez, Lukasz Kaiser, and Illia Polosukhin. Attention is all you need. In NeurIPS, pages 5998-6008, 2017.
- [Wang et al., 2023a] Chenyang Wang, Weizhi Ma, Chong Chen, Min Zhang, Yiqun Liu, and Shaoping Ma. Sequen- tial recommendation with multiple contrast signals. ACM Trans. Inf. Syst., pages 11:1-11:27, 2023.
- [Wang et al., 2023b] Zhaobo Wang, Yanmin Zhu, Chunyang Wang, Wenze Ma, Bo Li, and Jiadi Yu. Adaptive graph representation learning for next POI recommendation. In SIGIR, pages 393-402, 2023.
- [Wu et al., 2022] Yuxia Wu, Ke Li, Guoshuai Zhao, and Xueming Qian. Personalized long-and short-term prefer- ence learning for next POI recommendation. TKDE, pages 1944-1957, 2022.
- [Xu et al., 2023] Xiaohang Xu, Toyotaro Suzumura, Jiawei Yong, Masatoshi Hanai, Chuang Yang, Hiroki Kanezashi, Renhe Jiang, and Shintaro Fukushima. Revisiting mobility modeling with graph: A graph transformer model for next point-of-interest recommendation. In Proceedings of the 31st ACM International Conference on Advances in Geo- graphic Information Systems, pages 1-10, 2023.
- [Xu et al., 2024] Xiaohang Xu, Renhe Jiang, Chuang Yang, Zipei Fan, and Kaoru Sezaki. Taming the long tail in hu- man mobility prediction. NeurIPS, 2024.
- [Yan et al., 2023] Xiaodong Yan, Tengwei Song, Yifeng Jiao, Jianshan He, Jiaotuan Wang, Ruopeng Li, and Wei Chu. Spatio-temporal hypergraph learning for next POI recommendation. In SIGIR, pages 403-412, 2023.
- [Yang et al., 2019] Dingqi Yang, Bingqing Qu, Jie Yang, and Philippe Cudré-Mauroux. Revisiting user mobility and so- cial relationships in lbsns: A hypergraph embedding ap- proach. In WWW, pages 2147-2157, 2019.
- [Yang et al., 2020] Dingqi Yang, Benjamin Fankhauser, Paolo Rosso, and Philippe Cudré-Mauroux. Location pre- diction over sparse user mobility traces using rnns: Flash- back in hidden states! In IJCAI, pages 2184-2190, 2020. IJCAI
- [Yang et al., 2022] Song Yang, Jiamou Liu, and Kaiqi Zhao. Getnext: Trajectory flow map enhanced transformer for next POI recommendation. In SIGIR, pages 1144-1153, 2022.
- [Ye et al., 2024] Ziming Ye, Xiao Zhang, Xu Chen, Hui Xiong, and Dongxiao Yu. Adaptive clustering based per- sonalized federated learning framework for next POI rec- ommendation with location noise. TKDE, pages 1843- 1856, 2024.
- [Yin et al., 2023] Feiyu Yin, Yong Liu, Zhiqi Shen, Lisi Chen, Shuo Shang, and Peng Han. Next POI recommen- dation with dynamic graph and explicit dependency. In AAAI, pages 4827-4834, 2023.
- [Zhang and Chow, 2016] Jia-Dong Zhang and Chi-Yin Chow. Ticrec: A probabilistic framework to utilize temporal influence correlations for time-aware location recommendations. IEEE Trans. Serv. Comput., pages 633-646, 2016.
- [Zhang et al., 2023] Qinglin Zhang, Menghan Wang, Haiyan Wang, Xuan Rao, and Lisi Chen. Ssar-gnn: Self- supervised artist recommendation from spatio-temporal perspectives in art history with graph neural networks. Fu- ture Generation Computer Systems, 144:230-241, 2023.
- [Zhao et al., 2019] Pengpeng Zhao, Haifeng Zhu, Yanchi Liu, Jiajie Xu, Zhixu Li, Fuzhen Zhuang, Victor S. Sheng, and Xiaofang Zhou. Where to go next: A spatio-temporal gated network for next POI recommendation. In AAAI, pages 5877-5884, 2019.
- [Zhou et al., 2024] Hongli Zhou, Zhihao Jia, Haiyang Zhu, and Zhizheng Zhang. CLLP: contrastive learning frame- work based on latent preferences for next POI recommen- dation. In SIGIR, pages 1473-1482, 2024.
- [Zhuang et al., 2024] Zhuang Zhuang, Tianxin Wei, Lingbo Liu, Heng Qi, Yanming Shen, and Baocai Yin. TAU: tra- jectory data augmentation with uncertainty for next POI recommendation. In AAAI, pages 22565-22573, 2024.
References were extracted automatically from the PDF and may contain errors.
Full text extracted automatically from the PDF; figures, tables and equations may differ. The PDF is the version of record.
1 Introduction
With the popularization of location-based social media (e.g., Snapchat and Foursquare), many users share their life updates along with the associated locations, such as theaters, restaurants, and bars [Zhuang et al., 2024; Liu et al., 2016; Sun et al., 2020]. Leveraging these geographical records, next Point-of-Interest (POI) recommendation predicts each user's next likely movement based on his/her historical trajectories [Yang et al., 2020; Feng et al., 2015; Xu et al., 2023; Rao et al., 2025b; Rao et al., 2025a; Zhang et al., 2023]. Next POI recommendation facilitates many location-based applications such as navigation system [Qin et al., 2023; He et al., 2020], travel planning [Yang et al., 2019; Luo et al., 2021; Li et al., 2021], and personalized destination suggestions [Feng et al., 2018; Yang et al., 2022; Wang et al., 2023b].
†Corresponding Author
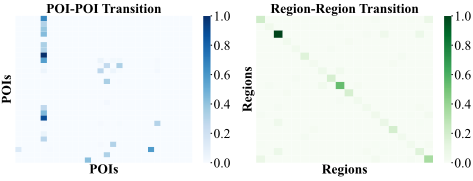
- (a) Transition patterns between POIs and regions
- (b) User preferences for POIs and regions
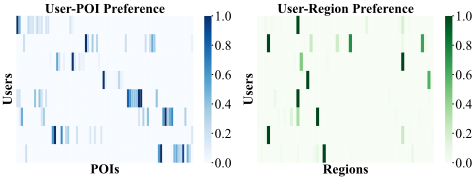
Figure 1: The transition patterns and user preferences for POIs and regions on Gowalla dataset, where regions are generated by running a clustering algorithm on the POI's geographical coordinates. The region transitions are more predictable than POI transitions, and different users have different preferences for the POIs and regions.
A plethora of methods have been proposed for next POI recommendation, and they can be classified into three categories, i.e., sequence-based, graph-based, and query-based. Sequence-based methods focus on the movement of individual users, capturing only the transition patterns between POIs within each user trajectory [Wu et al., 2022; Duan et al., 2023; Ye et al., 2024]. Graph-based methods first utilize all user trajectories to construct some POI transition graphs and then run Graph Neural Networks (GNNs) [He et al., 2020] on these graphs to learn POI representations [Yan et al., 2023; Zhou et al., 2024; Lai et al., 2024]. Query-based methods treat the timestamp of the next visit as a query and use a decoder to predict the visit location [Deng et al., 2024; Feng et al., 2024; Luo et al., 2023; Rao et al., 2024]. We discuss these methods with more details in Section 2.
We observe that existing next POI recommendation methods suffer from two limitations that hinder their accuracy:
- Tangled representations. Existing methods first merge the POI and context information (e.g., time, category, region) via addition or concatenation, and then use sequence models (e.g., RNN and Transformer) to capture the transition patterns of user trajectories. However, as shown in Figure 1(a), POIs and regions have distinct transition patterns. In particular, POI transitions are more dispersed, reflecting users' diverse movements across the locations, while region transitions are concentrated along the diagonal, suggesting that users tend to stay within adjacent regions. As existing methods entangle POI and region in a single model, they cannot model their distinct transition patterns, leading to suboptimal trajectory representations.
- Limited user preference modeling. Existing methods focus on modeling user preferences for POIs, either implicitly learning user preference representations [Yang et al., 2020; Rao et al., 2022] or explicitly training POI preference embeddings [Sun et al., 2024; Feng et al., 2024]. However, user preferences are also related to the contexts of the POIs, such as regions and categories. As shown in Figure 1(b), users exhibit distinct preferences for POIs and regions, and a user usually favors a small number of regions than POIs. Moreover, the POI and region preferences are also distinct for different users. Existing methods largely overlook user preferences for contexts and fail to model diverse user preferences, which hinders them from accurately capturing user behaviors.
In this paper, we propose DPRL, a disentangled and personalized representation learning method, to address the aforementioned limitations and produce accurate next POI recommendations. In particular, to avoid tangled trajectory representations, we analyze the transition patterns of various contexts and identify region as the primary context. Subsequently, we decouple POI and region representations and model their sequential regularities independently with separate spatial-temporal RNNs. Additionally, a focal loss function is employed to learn region transition patterns, and a straightforward fusion mechanism is introduced to enhance trajectory representations for POI prediction. To model diverse user preferences, we explicitly incorporate POI preference embeddings and region preference embeddings in addition to the common user identity embedding. A spatialtemporal aggregation mechanism is also designed to capture user preferences for POIs and regions explicitly. This mechanism includes two key components: integrating user preferences into disentangled sequential modeling to learn highquality trajectory representations, and combining spatialtemporal factors with user preferences to pinpoint past movements that benefit the current prediction.
We conduct extensive experiments to evaluate DPRL and compare it with 16 state-of-the-art baselines. The results show that DPRL consistently outperforms all baselines in accuracy, and compared with the best-performing baseline, DPRL achieves an improvement of 24.34% in the best case, 10.53% on average, and 2.71% in the worst case. Moreover, we perform an ablation study to validate our model designs, analyze the effect of DPRL's model parameters, and measure DPRL's running time. These results suggest that our designs
- are effective, and that DPRL runs efficiently.
To summarize, we make the following contributions:
- We observe that existing methods entangle POIs with contexts and conduct limited user preference modeling, resulting in suboptimal next POI prediction accuracy.
- We design DPRL as a disentangled and personalized representation learning framework to capture diverse sequential patterns and learn high-quality representations.
- We propose a novel spatial-temporal aggregation mechanism to capture user preferences for POIs and contexts for improved prediction accuracy.
- We conduct extensive experiments on two real-world datasets to test the performance of DPRL. The results show that DPRL significantly outperforms existing methods.
2 RelatedWork
Existing methods for next POI recommendation can be classified into three main categories, i.e., sequence-based, graphbased, and query-based.
Sequence-based methods. These methods focus on individual user trajectories and thus only capture the transition patterns between POIs within each user trajectory [Duan et al., 2023; Wang et al., 2023a]. For example, STRNN [Liu et al., 2016] extends Recurrent Neural Networks (RNNs) by incorporating spatial-temporal matrices that are derived from the intervals between consecutive user check-ins. DeepMove [Feng et al., 2018] integrates Transformer with gated recurrent units (GRU) to capture both long-term and short-term sequential patterns. GeoSAN [Lian et al., 2020] employs a gridding method to discretize the geographic space and leverages a self-attention module to capture correlations between POIs. STAN [Luo et al., 2021] utilizes two attention layers to explicitly capture the spatial-temporal correlations between POIs. MCLP [Sun et al., 2024] adopts Latent Dirichlet Allocation (LDA) to model user preferences and Transformer to capture transition patterns, and the time of the next visit is used as a guiding condition to enhance prediction accuracy.
Graph-based methods. These methods learn POI representations using all user trajectories, and the POI representations are then used to derive trajectory representations. As such, they can model the transition patterns from a global perspective. For instance, GETNEXT [Yang et al., 2022] runs Graph Neural Networks (GNNs) on a POI frequency transition graph to learn POI representations, which are subsequently fed into a Transformer to model sequential regularities. Graph-Flashback [Rao et al., 2022] constructs a POI transition graph using a spatial-temporal knowledge graph and employs an RNN to capture the transition patterns. AGRAN [Wang et al., 2023b] learns an adaptive POI graph, which is trained jointly with a Transformer to learn trajectory representations. SNPM [Yin et al., 2023] constructs a dynamic neighbor graph to identify POI dependencies across different timestamps. LoTNext [Xu et al., 2024] designs a graph adjustment method to denoise the POI transition graphs and introduces a tailored loss function to address the long-tail POI problem, where many POIs are visited only a few times.
Query-based methods. These methods treat the timestamp of the next user movement as a query and use a decoder to predict the next location. For instance, TPG [Luo et al., 2023] employs a geography-aware module to encode spatial information and a Transformer to model transition patterns. REPLAY [Deng et al., 2024] introduces a smooth time embedding module and utilizes an RNN to capture transition patterns. Both methods concatenate the query with the learned patterns and feed them to a decoder. AGCL [Rao et al., 2024] constructs multiple adaptive graphs to refine POI representations and directly adds the query to the Transformer's output to model user preferences. ROTAN [Feng et al., 2024] uses a rotation technique to incorporate time information into both user and POI embeddings, and use two Transformers to model transition patterns.
Nevertheless, all existing methods suffer from tangled trajectory representations and insufficient user preference modeling. In contrast, our DPRL decouples POI and context representations by modeling their sequential regularities separately and captures diverse user preferences for both POIs and contexts to produce personalized POI recommendations.
3 ProblemDefinition
We have U = {u1, u2, . . . uM} as the set of users, P = {p1, p2, . . . , pN} as the set of POIs, and R = {r1, r2, . . . rR} as the set of regions, which are generated by running a clustering algorithm on the POIs. As such, each POI pi is associated with a region and two geographical coordinates (r, lat, lng). Note that we use normal text (e.g., u) to denote variables and boldface (e.g., E and W) for embedding or weight matrices. Definition 1: (Check-in) A check-in c = (u, p, r, t) indicates that user u visited POI p in region r at time t. □ Definition 2: (User Trajectory) A user trajectory is a temporally ordered sequence of check-ins from a specific user u, which is expressed as Tu = {c1, c2, . . . , cv}. □ Definition 3: (Next POI Recommendation) Given a user u's trajectory Tu, next POI recommendation aims to identify the top-k POIs that u is most likely to visit next. □ Next POI recommendation uses accuracy as the main performance metric, which is usually measured by Hit Ratio (HR) and Mean Reciprocal Rank (MRR) [Rao et al., 2022]. These metrics evaluate how well the predicted POIs align with the POIs actually visited by the users, and higher values suggest
better performance.
4 DPRL
Figure 2 provides an overview of our DPRL method. In particular, DPRL comprises four main components: i) Context Embedding, which converts the discrete spatial-temporal information from a user trajectory into continuous representations; ii) Disentangled Spatial-Temporal Encoder to learn disentangled spatial-temporal representations from user trajectories. We design a dual-branch model structure that decouples POI and region representations and models their sequential regularities separately; iii) Comprehensive User Preference Modeling, which integrates user preferences for both POIs and regions via a spatial-temporal aggregation mechanism that considers both user preferences and spatialtemporal factors; iv) Query Enhanced Prediction, which predicts each user's next movement by leveraging the learned representations and treating the timestamp of the next movement as a query to guide predictions for enhanced accuracy.
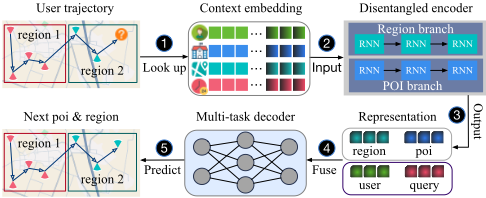
4.1 Context Embedding
Trajectory encoding. This component encodes discrete user and POI IDs into latent representations. Specifically, we utilize two randomly initialized embedding dictionaries: user embeddings Eu ∈ RM×d and POI embeddings Ep ∈ RN×d , where d represents the embedding dimension. The embeddings for each user and POI are denoted as eu and ep .
Attribute encoding. This component first transforms spatial (i.e., geographical coordinates) and temporal information (i.e., timestamps) into discrete IDs, which are then encoded into latent representations. Specifically, the geographical coordinates of POIs are clustered into regions using the k-means method [MacQueen and others, 1967]. We denote R as the number of regions. Each region is assigned a unique ID, creating a randomly initialized region embedding dictionary Er ∈ RR×d . For temporal information, a day is divided into 24 time slots by the hour to capture the daily periodicity of user behavior on weekdays. To distinguish between weekdays and weekends, 24 additional time slots are introduced for weekends. As such, a randomly initialized time embedding dictionary Et ∈ RS×d/2 is created, where S = 48, to represent the temporal attributes of POIs. The embeddings for each region and time slot are denoted as er and et .
4.2 Disentangled Spatial-Temporal Encoder
Context analysis. To avoid tangled trajectory representations, we aim to decouple POI and its contexts, and model their sequential regularities using separate models. As detailed in Section 4.1, the contexts of a POI mainly refer to its region and occurrence time. A naive idea is to model the sequential regularities of both region and time independently. Our exploratory experiments show that modeling region transitions significantly improves recommendation accuracy, which can be attributed to the fact that regions are predictable, i.e., users typically stay within or near the same region, as shown in Figure 1(b). This predictability allows the model to accurately capture region transition patterns and provide valuable auxiliary information for POI prediction.
However, modeling time transitions does not yield similar improvements; instead, it degrades recommendation accuracy. This is because time is a dynamic attribute of POIs with a oneto-many relationship because a POI can be visited at various time slots. This complexity, coupled with potential data sparsity, hinders the model from effectively capturing the time transition patterns. However, time still plays an important role in shaping the daily activity patterns and location preferences for users, such as having breakfast in the morning or dinner at night. As such, we treat the region as a POI's primary context for individual modeling and consider the visit time as an auxiliary context, which is used as a feature for POI prediction.
Disentangled sequential modeling. We utilize two spatialtemporal-aware recurrent neural networks (RNNs) to independently capture the sequential patterns of POIs and regions, respectively. Formally, given the POI representation sequence Sp = {ep1 , ep2 , · · · , epn} and the region representation sequence Sr = {er1 , er2 , · · · , ern}, we derive the corresponding POI hidden states Hp = {ˆhp1 , ˆhp2 , · · · , ˆhpn} and region hidden states Hr = {ˆhr1 , ˆhr2 , · · · , ˆhrn} as follows:
where Enc(·) represents the spatial-temporal-aware RNN and w(·) denotes a correlation function that incorporates spatialtemporal factors. This disentangled modeling preserves the semantic integrity of POIs and regions, ensuring accurate representation of each information, reducing information interference, and enhancing the clarity of the representations.
Next, we detail the designs of Enc(·) and w(·). To illustrate the modeling of spatial-temporal dependencies, we take POI sequential modeling as an example. Formally, given a POI representation sequence Sp = {ep1 , ep2 , · · · , epn}, we first use a basic RNN to compute all hidden states:
where σ is the tanh activation function, epi represents the POI embedding at time step i, hi-1 denotes the hidden state from the previous time step, and We,h ∈ Rd×d and b ∈ Rd are learnable parameters. To explicitly account for the temporal periodicity and spatial proximity of user behaviors, we compute the correlation between a historical visit j and current visit i based on spatial-temporal factor as follows:
where hvc(x) = 1+cos x 2 reflects temporal periodicity, ∆Di,j and ∆Ti,j represent the L2 spatial distance and temporal intervals between two POIs pi and pj, and α and β are the temporal and spatial decay weights, respectively. Then we leverage the correlations to identify past hidden states that contribute to the current prediction:
where wij = w(∆Ti,j,∆Di,j) denotes the correlation between two POIs pi and pj. Here, we utilize Enc(·) to encapsulate the processes defined in the Eq.(2,3,4).
Note that we also experimented with using a Transformer [Vaswani et al., 2017] as the backbone model but found that it performed worse than RNNs. This is likely because most users have short check-in trajectories, which RNNs are better suited to model. Moreover, we also experimented with constructing POI and region graphs and applying GNNs to learn refined POI and region representations [Yang et al., 2022; Rao et al., 2022; Wang et al., 2023b]. However, this approach performed worse, likely because the disentangled sequential modeling already captures fine-grained dynamic patterns for POIs and regions, and the graph's reinforcement of representations overlaps or conflicts with this modeling, suppressing the ability to capture dynamic information.
4.3 Comprehensive User Preference Modeling
User preference encoding. Although the transition patterns captured by Eq.( 2) and the correlation function w(·) in Eq.( 3) effectively focus on the POI-specific or regionspecific information, they overlook the broader user preferences associated with them. To capture comprehensive user preferences, we encode different user preferences for POI and region into latent representations. Specifically, we utilize two randomly initialized embedding dictionaries: POI preference embedding Eu p ∈ RM×d and region preference embedding Eu r ∈ RM×d . The preference embeddings for each POI and region are denoted as eup and eur , respectively.
Personalized trajectory representation. We propose a spatial-temporal aggregation mechanism to explicitly capture user preferences for both POIs and regions. Human behaviors are often influenced by periodic patterns and intentions, such as having breakfast in the morning or dinner at night [Zhang and Chow, 2016]. Therefore, we model dynamic user preferences by employing the Time2Rotation (T2R) technique [Sun et al., 2019; Feng et al., 2024], which effectiely integrates temporal information into user preference modeling:
ˆ eup = T2R(eup , rt) = eup ◦ rt, where |rt| = 1, (5) where rt represents the rotation associated with time embedding et , and ◦ denotes the Hadamard (element-wise) product. Unlike traditional strategies such as concatenation or addition, T2R preserves the original space of the POI preference embedding eup . Similarly, the region preference embedding ˆ eur can be derived using the same T2R technique. Afterwards, we incorporate the user preferences for POIs and regions into sequential modeling by modifying Eq.(2):
where [; ] denotes the concatenation operation. Moreover, to further enhance user preference modeling, we integrate user preferences into the correlation function w(·):
where || · ||2 represents the L2 distance. This formulation results in a new correlation function ˆw(·), which accounts for both user preference factors and spatial-temporal factors. Finally, we use ˆw(·) to compute all POI hidden states Hp = Enc(Sp, ˆw) and region hidden states Hr = Enc(Sr, ˆw).
4.4 Query Enhanced Prediction
Region prediction. The region branch of the disentangled spatial-temporal encoder produces an output ˆhrt at each time step t, which is concatenated with the dynamic region preference embedding ˆ eup , and the user embedding eu into a new vector. This vector is then passed through a fully connected layer to generate the final region prediction:
where W r f ∈ R4d×R is the learnable weight matrix. Region prediction can offer additional supervision signals and enhance the effectiveness of model training.
POI prediction. Similarly, we use a fully connected layer to generate the final POI prediction. Following [Luo et al., 2023; Feng et al., 2024], the ground truth next time is used as a query to guide the POI prediction:
where ¯hpt = ˆhpt + ˆhrt and ¯ eup = ˆ eup + ˆ eur represent the fused trajectory representation and user preference, as region information aids POI prediction. Note that we avoid using the query to predict regions in Eq.(8), as they are less sensitive to specific time slots. Additionally, the predicted region is excluded from guiding next POI prediction due to its inaccuracy, which degrades performance in our experiments.
4.5 Model Training
When considering the next movements, users often move within a small spatial range close to their current location. As a result, in a region sequence, consecutive positions often share the same region ID, such as multiple repeated occurrences of the same region in adjacent positions. In this case, a standard cross-entropy loss struggles to capture rare but important region transition patterns. To mitigate this, we adopt focal loss [Lin et al., 2017], which handles class imbalance by down-weighting well-classified samples and focusing on hard-to-classify ones, emphasizing rare and critical patterns more effectively. Formally, the focal loss function is defined:
where n denotes the length of the user trajectory, η = 0.25 balances class importance, γ = 2 emphasizes hard-to-classify samples, and yu r ∈ ˆ yu r,i represents the predicted probability of the region label for user u. Since POI sequences rarely exhibit the repetitive patterns described above, we use the standard cross-entropy function as the POI loss function:
where yu k ∈ ˆ yu p,i and ˆ yu j ∈ ˆ yu p,i represent the predicted probabilities of POI label and other POIs for user u, respectively. Combined with the region loss and POI loss, our multi-task learning objective is defined as follows:
| Dataset | Gowalla | Foursquare |
|---|---|---|
| Period | 02/2009-10/2010 | 04/2012-01/2014 |
| # Users | 7,768 | 45,343 |
| # POIs | 106,994 | 68,879 |
| # Check-ins | 1,823,598 | 9,361,228 |
| # Trajectories | 84,357 | 429,071 |
| # Sparsity | 0.9978 | 0.9969 |
| # Avg. | 234.76 | 206.45 |
where ||Θ||2 represents the L2 regularization term, and the parameters λ and µ control the magnitude of the region loss and regularization loss, respectively. Θ is optimized by minimizing L via gradient descent.
5 Experimental Evaluation
In this section, we conduct extensive experiments to evaluate the effectiveness of our DPRL. We aim to answer the following research questions:
- RQ1: How does the recommendation accuracy of DPRL compare with state-of-the-art algorithms?
- RQ2: How do DPRL's designs contribute to accuracy?
- RQ3: How do DPRL's parameters affect accuracy?
- RQ4: How efficient is DPRL for training and inference?
5.1 Experiment Settings
Datasets. We evaluate DPRL on two widely used realworld datasets: Gowalla 1 and Foursquare 2 . Gowalla contains check-ins from February 2009 to October 2010, while Foursquare covers the period from April 2012 to January 2014. Each check-in includes a user ID, POI ID, latitude, longitude, and timestamp. Following the preprocessing method in [Yang et al., 2020; Yin et al., 2023], we filter out inactive users with fewer than 100 check-ins and sort each user's check-ins by ascending timestamp. The first 80% of the check-ins for each user are split into equal length sequences (e.g., 20) to form the training set, while the remaining 20% are used for testing. Table 1 summarizes the statistical characteristics of the two datasets.
Baselines. We consider the following 16 representative methods as the baselines, including the traditional methods (PRME [Feng et al., 2015] and LBSN2Vec [Yang et al., 2019]), sequence-based methods (STRNN [Liu et al., 2016], DeepMove [Feng et al., 2018], STGN [Zhao et al., 2019], LSTPM [Sun et al., 2020], Flashback [Yang et al., 2020], STAN [Luo et al., 2021], and MCLP [Sun et al., 2024]), graph-based methods (GETNext [Yang et al., 2022], Graph-Flashback [Rao et al., 2022], SNPM [Yin et al., 2023], AGRAN [Wang et al., 2023b], LoTNext [Xu et al., 2024]), and query-based methods (TPG [Luo et al., 2023], and ROTAN [Feng et al., 2024]).
Evaluation protocol. We adopt two commonly used evaluation metrics from prior research [Yang et al., 2020; Rao et al.,
1 http://snap.stanford.edu/data/loc-gowalla.html
2 https://sites.google.com/site/yangdingqi/home
| Methods | Gowalla | Foursquare | ||||||
|---|---|---|---|---|---|---|---|---|
| HR@1 (↑) | HR@5 (↑) | HR@10 (↑) | MRR (↑) | HR@1 (↑) | HR@5 (↑) | HR@10 (↑) | MRR (↑) | |
| PRME | 0.0740 | 0.2146 | 0.2899 | 0.1503 | 0.0982 | 0.3167 | 0.4064 | 0.2040 |
| LBSN2Vec | 0.0864 | 0.1186 | 0.1390 | 0.1032 | 0.2190 | 0.3955 | 0.4621 | 0.2781 |
| STRNN | 0.0900 | 0.2120 | 0.2730 | 0.1508 | 0.2290 | 0.4310 | 0.5050 | 0.3248 |
| DeepMove | 0.0625 | 0.1304 | 0.1594 | 0.0982 | 0.2400 | 0.4319 | 0.4742 | 0.3270 |
| STGN | 0.0624 | 0.1586 | 0.2104 | 0.1125 | 0.2094 | 0.4734 | 0.5470 | 0.3283 |
| LSTPM | 0.0721 | 0.1843 | 0.2327 | 0.1306 | 0.2484 | 0.4489 | 0.5018 | 0.3365 |
| Flashback | 0.1158 | 0.2754 | 0.3479 | 0.1925 | 0.2496 | 0.5399 | 0.6236 | 0.3805 |
| STAN | 0.0891 | 0.2096 | 0.2763 | 0.1523 | 0.2265 | 0.4515 | 0.5310 | 0.3420 |
| MCLP | 0.1404 | 0.3139 | 0.3900 | 0.2232 | 0.2980 | 0.6027 | 0.6837 | 0.4353 |
| GETNext | 0.1419 | 0.3270 | 0.4081 | 0.2294 | 0.2646 | 0.5640 | 0.6431 | 0.3988 |
| Graph-Flashback | 0.1512 | 0.3425 | 0.4256 | 0.2422 | 0.2805 | 0.5757 | 0.6514 | 0.4136 |
| SNPM | 0.1593 | 0.3514 | 0.4346 | 0.2505 | 0.2899 | 0.5967 | 0.6763 | 0.4278 |
| AGRAN | 0.1005 | 0.2456 | 0.3154 | 0.1731 | 0.1575 | 0.3736 | 0.4676 | 0.2600 |
| LoTNext | 0.1668 | 0.3605 | 0.4429 | 0.2591 | 0.3155 | 0.6059 | 0.6812 | 0.4469 |
| TPG | 0.1400 | 0.3071 | 0.3611 | 0.1948 | 0.2321 | 0.4631 | 0.5493 | 0.3775 |
| ROTAN | 0.1416 | 0.2851 | 0.3502 | 0.2125 | 0.2691 | 0.5381 | 0.6203 | 0.3915 |
| DPRL (Ours) | 0.2074 | 0.3936 | 0.4761 | 0.2970 | 0.3622 | 0.6256 | 0.7022 | 0.4820 |
| Improvement (%) | 24.34% | 9.18% | 7.50% | 14.63% | 14.80% | 3.25% | 2.71% | 7.85% |
2022]: Hit Ratio@K (HR@K) and Mean Reciprocal Rank (MRR) to assess the performance of DPRL. HR@K represents the proportion of true positive samples among the predicted top-K samples. Unlike HR@K, which focuses on topK samples, MRR directly evaluates the overall recommendation performance. For both metrics, higher values indicate better accuracy. In our experiments, we adopt the commonly used K = {1, 5, 10}.
Implementation details. We use the Adam optimizer with default betas, a learning rate of 0.01, a time slot number S of 48, and an embedding dimension d of 30 for Gowalla and 20 for Foursquare. µ is set to 1e-5 for Gowalla and 1e-6 for Foursquare, while λ is set to 0.5 for Gowalla and 0.1 for Foursquare. The region size R is 4000 for Gowalla and 3000 for Foursquare. The spatial-temporal decay factors α and β follow the default settings in [Yang et al., 2020; Rao et al., 2022]. Our implementation is available on Pytorch 3 .
5.2 Main Results (RQ1)
Table 2 shows the results of the experiments on the Gowalla and Foursquare datasets. Based on these results, we have the following observations and corresponding analyses:
- The results of the Gowalla and Foursquare datasets demonstrate that our proposed DPRL significantly outperforms all other state-of-the-art baselines across all evaluation metrics. Specifically, on the Gowalla dataset, DPRL outperforms the second-best method with improvements of 24.34%, 9.18%, 7.50%, and 14.63% on HR@1, HR@5, HR@10, and MRR. Additionally, DPRL achieves average improvements of 7.15% compared to the second-best
3 https://github.com/kevin-xuan/DPRL
- method on the Foursquare datasets. In a nutshell, these findings clearly show the superiority of our method DPRL.
- Compared to the best sequence-based method MCLP and the query-based method ROTAN, our DPRL demonstrates a significant overall improvement. This can be attributed to several key factors: 1) By decoupling POI and region embeddings and individually modeling their sequential regularities, DPRL preserves the semantic integrity of POIs and regions, and ensures accurate representations of each type of information. 2) Explicitly modeling diverse user preferences on POI and contexts effectively guides the sequential model for personalized recommendations.
- Apart from AGRAN, most graph-based methods outperform sequence-based methods on the Gowalla dataset due to their stronger POI representations. AGRAN's poor performance may result from the large number of POIs, limiting its ability to learn an effective adaptive graph. However, on the denser Foursquare dataset, the best sequencebased method, MCLP, surpasses most graph-based methods, showing that with advanced model architecture and sufficient data, sequence-based methods can bridge the representation gap of GNNs. Our DPRL further validates this on all datasets and demonstrates notable improvements on the sparser Gowalla dataset, highlighting its strong ability to handle sparse data.
5.3 Micro Results and Design Analysis
Ablation study (RQ2). To show the effects of DPRL's components, we conduct ablation experiments on all datasets and form the different variants as follows:
- w Con and w Add combine POI, time, and region embeddings through concatenation or addition.
| Variants | Gowalla | Foursquare | ||
|---|---|---|---|---|
| HR@5 | HR@10 | HR@5 | HR@10 | |
| DPRL | 0.3936 | 0.4761 | 0.6256 | 0.7022 |
| w Con | 0.3530 | 0.4183 | 0.6134 | 0.6865 |
| w Add | 0.3544 | 0.4215 | 0.6120 | 0.6853 |
| w/o UP | 0.3669 | 0.4355 | 0.6158 | 0.6898 |
| w SP | 0.3728 | 0.4488 | 0.6147 | 0.6904 |
| w/o US | 0.3839 | 0.4596 | 0.6188 | 0.6978 |
| w/o MTL | 0.3940 | 0.4741 | 0.6217 | 0.6997 |
| w CE | 0.3921 | 0.4720 | 0.6211 | 0.6981 |
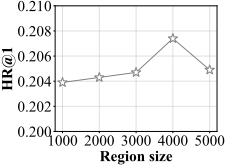
- (a) Region size R
- (c) Hidden dimension d
- (b) Region loss weight λ
- w/o UP and w/o US remove the user preference embeddings and the user preference factors used in the correlation function, respectively. w SP uses the same user preference embeddings for both POI and region.
- w/o MTL removes the region loss, while w CE applies a standard cross-entropy for the region loss.
As shown in Table 3, we have the following findings:
- We notice that both w Con and w Add perform worse than DPRL, highlighting the effectiveness of disentangled representation learning to capture sequential regularities.
- We observe that w/o UP, w SP, and w/o US show a notable performance decline compared to DPRL, highlighting the importance of comprehensive user preference modeling.
- We find that the region loss Lr provides additional supervision signals, enhancing training effectiveness. Moreover, focal loss better highlights rare and critical patterns compared to cross-entropy loss.
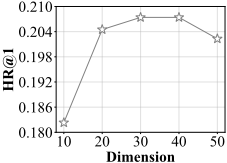
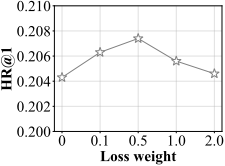
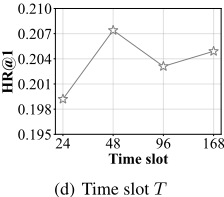
Hyper-parameters (RQ3). We conduct experiments to analyze the impacts on HR@1 of four critical hyper-parameters on the Gowalla dataset: region size R, region loss weight λ, hidden dimension d, and number of time slot T. Figure 3(a) shows that R = 4000 is the optimal number of regions. Too few regions result in coarse divisions, while too many weaken spatial correlation due to over-refinement. Figure 3(b) shows that a region loss weight of λ = 0.5 achieves the best performance. The performance initially improves as the weight increases, highlighting the impact of region loss. However, further increases overemphasize region prediction, hindering the capture of POI transition patterns. Figure 3(c) shows that a hidden dimension of d = 30 yields the best performance. Smaller dimensions fail to capture complex sequential patterns, while larger dimensions risk over-fitting due to excessive parameters. As shown in Figure 3(d), recognizing weekday-weekend differences and selecting an appropriate time slot granularity (e.g., 1 hour) are crucial to capture user behavior patterns and enhance accuracy.
| Methods | Gowalla | Foursquare | ||
|---|---|---|---|---|
| Train | Test | Train | Test | |
| Flashback | 26 | 108 | 91 | 491 |
| ROTAN | 55 | 234 | 217 | 1164 |
| Graph-Flashback | 53 | 221 | 141 | 756 |
| SNPM | 174 | 639 | 1238 | 2408 |
| LoTNext | 122 | 448 | 858 | 1669 |
| DPRL (Ours) | 35 | 149 | 129 | 692 |
Efficiency analysis (RQ4). Table 4 compares the average training and test time of DPRL with five representative methods across all datasets, including Flashback (sequencebased), ROTAN (query-based), and graph-based methods (Graph-Flashback, SNPM, and LoTNext). All methods are performed on the same NVIDIA A10 GPU with identical batch size. Flashback's simple RNN efficiently captures sequential regularities, while ROTAN's multilayer Transformers increase its runtime compared to DPRL. Among graphbased methods, Graph-Flaskback incurs extra overhead due to GNN, SNPM requires additional time to search similar neighborhoods in the graph, and LoTNext is slower than Graph-Flashback due to graph denoising and an auxiliary temporal prediction task. In summary, DPRL achieves competitive efficiency, ranking among the fastest baselines.
6 Conclusion
In this paper, we propose a disentangled and personalized representation learning (DPRL) framework for the next POI recommendation task. To learn high-quality trajectory representations, we decouple POIs and contexts, and model their sequential regularities separately. To model comprehensive user preference, we propose a novel spatial-temporal aggregation mechanism to capture user preferences for POIs and contexts. Moreover, we also adopt a temporal query to guide the predictions for enhanced accuracy. We conduct extensive experiments and analyses on two real-world datasets, which show that DPRL significantly outperforms state-ofthe-art baselines in recommendation accuracy.
Acknowledgments
This paper was supported by the National Key R&D Program of China 2024YFE0111800, and NSFC U22B2037, U21B2046, and 62032001.
@inproceedings{ijcai2025p856,
  title     = {Disentangled and Personalized Representation Learning for Next Point-of-Interest Recommendation},
  author    = {Rao, Xuan and Shang, Shuo and Chen, Lisi and Jiang, Renhe and Han, Peng},
  booktitle = {Proceedings of the Thirty-Fourth International Joint Conference on
               Artificial Intelligence, {IJCAI-25}},
  publisher = {International Joint Conferences on Artificial Intelligence Organization},
  editor    = {James Kwok},
  pages     = {7697--7705},
  year      = {2025},
  month     = {8},
  note      = {Main Track},
  doi       = {10.24963/ijcai.2025/856},
  url       = {https://doi.org/10.24963/ijcai.2025/856},
}
TY - CPAPER TI - Disentangled and Personalized Representation Learning for Next Point-of-Interest Recommendation AU - Rao, Xuan AU - Shang, Shuo AU - Chen, Lisi AU - Jiang, Renhe AU - Han, Peng T2 - Proceedings of the Thirty-Fourth International Joint Conference on Artificial Intelligence, IJCAI-25 PB - International Joint Conferences on Artificial Intelligence Organization PY - 2025 SP - 7697 EP - 7705 DO - 10.24963/ijcai.2025/856 UR - https://doi.org/10.24963/ijcai.2025/856 ER -Copied
Machine-readable versions of this paper, for tools and AI agents:





