
TESTN: A Triad-Enhanced Spatio-Temporal Network for Multi-Temporal POI Relationship Inference
Proceedings of the Thirty-Fourth International Joint Conference on Artificial Intelligence. Main Track. Pages 7786-7794.
https://doi.org/10.24963/ijcai.2025/866
Keywords
- Multidisciplinary Topics and Applications: MTA: Transportation
Abstract
Multi-temporal Point-of-Interest (POI) relationship inference aims to identify evolving relationships among locations over time, providing critical insights for location-based services. While existing studies have made substantial efforts to model relationships with custom-designed graph neural networks, they face the challenge of leveraging POI contextual information characterized by spatial dependencies and temporal dynamics, as well as capturing the heterogeneity of multi-type relationships. To address these challenges, we propose a Triad-Enhanced Spatio-Temporal Network (TESTN), which conceptualizes triads as interactions between relationships for capturing potential interplay. Specifically, TESTN incorporates the spatial 2-hop aggregation layer to capture geographical and semantic information beyond first-order neighbors and the temporal context extractor to integrate relational dynamics within adjacent time segments. Furthermore, we introduce a self-supervised pairwise neighboring relation consistency detection scheme to preserve the heterogeneity of multi-type relationships. Extensive experiments on three real-world datasets demonstrate the superior performance of our TESTN framework.
- [Chen et al., 2022] Yile Chen, Xiucheng Li, Gao Cong, Cheng Long, Zhifeng Bao, Shang Liu, Wanli Gu, and Fuzheng Zhang. Points-of-interest relationship infer- ence with spatial-enriched graph neural networks. arXiv preprint arXiv:2202.13686, 2022.
- [Deng et al., 2023] Liwei Deng, Hao Sun, Yan Zhao, Shuncheng Liu, and Kai Zheng. S2tul: A semi-supervised framework for trajectory-user linking. In Proceedings of the sixteenth ACM international conference on web search and data mining, pages 375-383, 2023.
- [Han et al., 2022] Jindong Han, Hao Liu, Haoyi Xiong, and Jing Yang. Semi-supervised air quality forecast- ing via self-supervised hierarchical graph neural network. IEEE Transactions on Knowledge and Data Engineering, 35(5):5230-5243, 2022.
- [He et al., 2016] Kaiming He, Xiangyu Zhang, Shaoqing Ren, and Jian Sun. Deep residual learning for image recog- nition. In Proceedings of the IEEE conference on computer vision and pattern recognition, pages 770-778, 2016.
- [Jalili et al., 2017] Mahdi Jalili, Yasin Orouskhani, Milad Asgari, Nazanin Alipourfard, and Matjaž Perc. Link pre- diction in multiplex online social networks. Royal Society open science, 4(2):160863, 2017.
- [Ji et al., 2023] Jiahao Ji, Jingyuan Wang, Chao Huang, Junjie Wu, Boren Xu, Zhenhe Wu, Junbo Zhang, and Yu Zheng. Spatio-temporal self-supervised learning for traffic flow prediction. In Proceedings of the AAAI Con- ference on Artificial Intelligence, volume 37, pages 4356- 4364, 2023.
- [Jin et al., 2023] Guangyin Jin, Yuxuan Liang, Yuchen Fang, Zezhi Shao, Jincai Huang, Junbo Zhang, and Yu Zheng. Spatio-temporal graph neural networks for predictive learning in urban computing: A survey. IEEE Transac- tions on Knowledge and Data Engineering, 2023.
- [Kingma and Ba, 2014] Diederik P Kingma and Jimmy Ba. Adam: A method for stochastic optimization. arXiv preprint arXiv:1412.6980, 2014.
- [Kipf and Welling, 2017] Thomas N. Kipf and Max Welling. Semi-supervised classification with graph convolutional networks. In 5th International Conference on Learning Representations, ICLR 2017, Toulon, France, April 24-26, 2017, Conference Track Proceedings, 2017.
- [Lee et al., 2022] Namkyeong Lee, Dongmin Hyun, Junseok Lee, and Chanyoung Park. Relational self-supervised learning on graphs. In Proceedings of the 31st ACM Inter- national Conference on Information & Knowledge Man- agement, pages 1054-1063, 2022.
- [Li et al., 2006] Rui Li, Shenghua Bao, Jin Wang, Yong Yu, and Yunbo Cao. Cominer: An effective algorithm for mining competitors from the web. In Sixth International Conference on Data Mining (ICDM'06), pages 948-952. IEEE, 2006.
- [Li et al., 2018] Qimai Li, Zhichao Han, and Xiao-Ming Wu. Deeper insights into graph convolutional networks for semi-supervised learning. In AAAI conference on artificial intelligence, volume 32, page 3538-3545, 2018.
- [Li et al., 2020] Shuangli Li, Jingbo Zhou, Tong Xu, Hao Liu, Xinjiang Lu, and Hui Xiong. Competitive analysis for points of interest. In Proceedings of the 26th ACM SIGKDD international conference on knowledge discov- ery & data mining, pages 1265-1274, 2020.
- [Li et al., 2023a] Shuangli Li, Jingbo Zhou, Ji Liu, Tong Xu, Enhong Chen, and Hui Xiong. Multi-temporal relation- ship inference in urban areas. In Proceedings of the 29th ACM SIGKDD conference on knowledge discovery and data mining, pages 1316-1327, 2023.
- [Li et al., 2023b] Yi Li, Weiming Huang, Gao Cong, Hao Wang, and Zheng Wang. Urban region representation learning with openstreetmap building footprints. In Pro- ceedings of the 29th ACM SIGKDD Conference on Knowl- edge Discovery and Data Mining, pages 1363-1373, 2023.
- [Liu et al., 2022] Yu Liu, Jingtao Ding, and Yong Li. Devel- oping knowledge graph based system for urban comput- ing. In Proceedings of the 1st ACM SIGSPATIAL Interna- tional Workshop on Geospatial Knowledge Graphs, pages 3-7, 2022.
- [Mikolov et al., 2013] Tomas Mikolov, Ilya Sutskever, Kai Chen, Greg S Corrado, and Jeff Dean. Distributed rep- resentations of words and phrases and their composition- ality. Advances in neural information processing systems, 26, 2013.
- [Rao et al., 2022] Xuan Rao, Lisi Chen, Yong Liu, Shuo Shang, Bin Yao, and Peng Han. Graph-flashback network for next location recommendation. In Proceedings of the 28th ACM SIGKDD conference on knowledge discovery and data mining, pages 1463-1471, 2022.
- [Shen et al., 2024] Dazhong Shen, Chuan Qin, Qi Zhang, Hengshu Zhu, and Hui Xiong. Handling over-smoothing and over-squashing in graph convolution with maximiza- tion operation. IEEE Transactions on Neural Networks and Learning Systems, 2024.
- [Sun et al., 2022] Mengzhu Sun, Xi Zhang, Jiaqi Zheng, and Guixiang Ma. Ddgcn: Dual dynamic graph convolutional networks for rumor detection on social media. In Proceed- ings of the AAAI conference on artificial intelligence, vol- ume 36, pages 4611-4619, 2022.
- [Tobler, 1970] Waldo R Tobler. A computer movie simulat- ing urban growth in the detroit region. Economic geogra- phy, 46(sup1):234-240, 1970.
- [Van der Maaten and Hinton, 2008] Laurens Van der Maaten and Geoffrey Hinton. Visualizing data using t-sne. Journal of machine learning research, 9(11), 2008.
- [Veličković et al., 2017] Petar Veličković, Guillem Cucurull, Arantxa Casanova, Adriana Romero, Pietro Lio, and Yoshua Bengio. Graph attention networks. arXiv preprint arXiv:1710.10903, 2017.
- [Velickovic et al., 2019] Petar Velickovic, William Fedus, William L Hamilton, Pietro Liò, Yoshua Bengio, and R Devon Hjelm. Deep graph infomax. ICLR, 2(3):4, 2019.
- [Wang et al., 2024a] Chenhao Wang, Lisi Chen, Shuo Shang, Christian S Jensen, and Panos Kalnis. Multi- scale detection of anomalous spatio-temporal trajectories in evolving trajectory datasets. In Proceedings of the 30th ACM SIGKDD Conference on Knowledge Discovery and Data Mining, pages 2980-2990, 2024.
- [Wang et al., 2024b] Yu Wang, Tongya Zheng, Yuxuan Liang, Shunyu Liu, and Mingli Song. Cola: Cross-city mobility transformer for human trajectory simulation. In Proceedings of the ACM on Web Conference 2024, pages 3509-3520, 2024.
- [Xu et al., 2022] Jia Xu, Fei Xiong, Zulong Chen, Mingyuan Tao, Liangyue Li, and Quan Lu. G2net: A general geography-aware representation network for hotel search ranking. In Proceedings of the 28th ACM SIGKDD Con- ference on Knowledge Discovery and Data Mining, pages 4237-4247, 2022.
- [Xu et al., 2024] Yang Xu, Gao Cong, Lei Zhu, and Lizhen Cui. Mmpoi: A multi-modal content-aware framework for poi recommendations. In Proceedings of the ACM on Web Conference 2024, pages 3454-3463, 2024.
- [Yang et al., 2012] Yang Yang, Jie Tang, Jacklyne Keomany, Yanting Zhao, Juanzi Li, Ying Ding, Tian Li, and Liang- wei Wang. Mining competitive relationships by learning across heterogeneous networks. In Proceedings of the 21st ACM international conference on Information and knowl- edge management, pages 1432-1441, 2012.
- [Yang et al., 2014] Dingqi Yang, Daqing Zhang, Vincent W Zheng, and Zhiyong Yu. Modeling user activity prefer- ence by leveraging user spatial temporal characteristics in lbsns. IEEE Transactions on Systems, Man, and Cybernet- ics: Systems, 45(1):129-142, 2014.
- [Yang et al., 2015] Bishan Yang, Scott Wen-tau Yih, Xi- aodong He, Jianfeng Gao, and Li Deng. Embedding enti- ties and relations for learning and inference in knowledge bases. In Proceedings of the International Conference on Learning Representations (ICLR) 2015, 2015.
- [You et al., 2022] Jiaxuan You, Tianyu Du, and Jure Leskovec. Roland: graph learning framework for dynamic graphs. In Proceedings of the 28th ACM SIGKDD con- ference on knowledge discovery and data mining, pages 2358-2366, 2022.
References were extracted automatically from the PDF and may contain errors.
Full text extracted automatically from the PDF; figures, tables and equations may differ. The PDF is the version of record.
1 Introduction
The rapid advancement of location-based services has encouraged users to share their geographical locations through check-ins at various Points of Interest (POIs). This has resulted in the generation of large-scale geographic data, which has significantly advanced the development of smart city applications [Wang et al., 2024b; Rao et al., 2022; Deng et al., 2023], enabling more intelligent services for users, businesses, and governments. A fundamental operation to support these applications is POI relationship inference, which has gained increasing attention due to its broad applicability in commercial management and the analysis of urban mobility patterns [Li et al., 2020; Chen et al., 2022; Liu et al., 2022; Li et al., 2023a].
∗Corresponding authors.
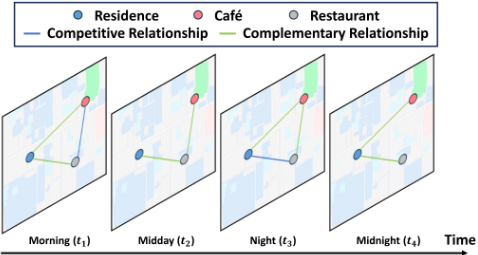
Existing solutions to POI relationship inference use the graph-based model with spatial information to identify missing relationships [Li et al., 2020; Chen et al., 2022; Li et al., 2023a]. However, most studies [Li et al., 2020; Chen et al., 2022] focus on static relationships, overlooking temporal dynamics. As shown in Figure 1, the relationship between two POI locations may evolve over time. For instance, the complementary relationship between the caf´e and the residence vanishes, while the competitive relationship between the caf´e and the restaurant converts to the complementary relationship by midday. There are very limited studies on multi-temporal POI relationship inference for dynamic relationships. Compared with conventional time-independent relationship inference problems, it has a greater practical application value due to more fine-grained relationship mining [Li et al., 2023a].
Although existing studies have achieved some success in the POI relationship inference, they still face challenges in the following aspects that hinder their effectiveness.
(1) Exploiting the POI contextual information with spatial dependencies and temporal dynamics. Due to data sparsity caused by spatial proximity and temporal constraint, where most POI relationships exist within a limited distance range and time period, the dynamic relationship graph faces difficulties in aggregating effective contextual information. As discussed in existing multi-temporal POI relationship inference study [Li et al., 2023a], most spatio-temporal GNNs [Jin et al., 2023] focus on modeling continuous time series, they are not suitable for multi-temporal POI relationship inference that focuses on the evolution of dynamic POI relationships.
(2) Effectively modeling the heterogeneity of multitype relationships. POI nodes can have multiple types of relationships with other nodes. Existing methods [Chen et al., 2022] typically adopt a two-stage aggregation strategy to model interactions between multi-type relationships. In the first stage, they aggregate the representations of nodes within the same type of relationship using graph neural networks. In the second stage, they aggregate the representations across different relationships through summation or other functions. However, since all adjacent nodes of the same type are aggregated in the first stage, these methods inherently lead to a coarse-grained interaction between different types of relationship and thus have limited ability to model relational heterogeneity.
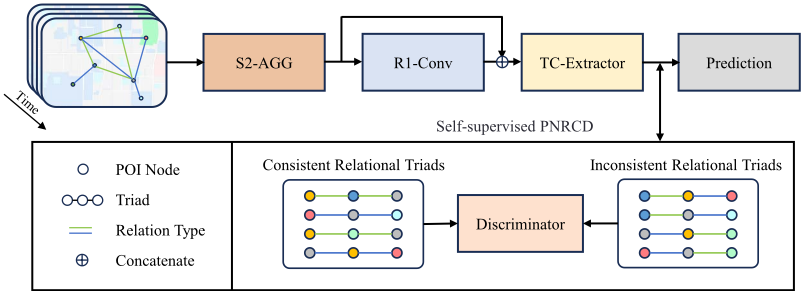
In this light, we propose a Triad-Enhanced SpatioTemporal Network (TESTN) for multi-temporal POI relationship inference. Intuitively, relationships are conceptualized as interactions between two nodes. Extending this perspective, triads linked by two relationships can be viewed as interactions between adjacent relationships. This high-level interaction contributes to capturing the intricate interplay between relationships that traditional methods may overlook. To address the first challenge, we develop the Spatial 2-hop Aggregation Layer (S2-AGG) and Temporal Context Extractor (TC-Extractor). Specifically, S2-AGG utilizes secondorder spatial neighbors to explore potential geographical and semantic information, while TC-Extractor integrates contextual information from adjacent time segments by sequentially fusing one-hop relationships in both the temporal and spatial dimensions. To address the second challenge, we introduce the self-supervised Pairwise Neighboring Relation Consistency Detection (PNRCD) that distinguishes relational triads to preserve the heterogeneity of multi-type relationships.
The main contributions are summarized as follows:
- We propose a multi-temporal POI relationship inference framework, TESTN, which enhances relationship interactions with triad structure from both spatio-temporal view and relationship consistency view.
- We leverage spatial proximity and temporal evolution with a self-supervised pairwise neighboring relation consistency detection task to exploit contextual information and model the heterogeneity of multi-type relationships.
- Extensive experiments on three real-world datasets demonstrate the substantial superiority of TESTN in HR and MRR metrics. Further analysis reveals that triad-enhanced S2-AGG, TC-Extractor, and PNRCD modules play a critical role in enhancing relationship inference. Our source code is available at https://github.com/wanghyhy/TESTN.
2 RelatedWork
In this section, we review the existing literature related to our work, including GNN-based POI relationship inference and self-supervised learning.
2.1 GNN-based POI Relationship Inference
Unlike the conventional relationship inference task [Yang et al., 2012; Jalili et al., 2017; Li et al., 2006], the key to POI relationship inference is effectively modeling the various interactions within the spatial context. Many efforts have been devoted to advancing POI relationship inference through different approaches. With the ability to capture intricate relationships and dependencies among nodes, graph neural networks offer a significant advantage in modeling non-Euclidean spaces [Wang et al., 2024a; Sun et al., 2022; Xu et al., 2024]. These strengths make GNNs particularly effective in revealing hidden relationships and dynamics within complex relationship graphs. To discover the competitive relationship of POIs, DeepR [Li et al., 2020] constructs a heterogeneous POI information network composed of POIs, brands, aspects, and their relationships, and proposes a spatial adaptive graph neural network to capture spatial distance dependencies. PRIM [Chen et al., 2022] introduces a weighted relational graph neural network and a self-attentive spatial context extractor to tackle multi-type POI relationship inference. Considering the temporal dynamics of POI relationships, SEENet [Li et al., 2023a] develops a spatially evolving graph neural network with self-supervised global spatial information maximum and local relational evolving constraint tasks to discover multi-temporal relationships. Despite significant efforts in existing methods, they do not effectively explore the spatio-temporal contextual information, which is crucial for multi-temporal relationship inference. In this paper, we introduce a triad-enhanced spatio-temporal network that exploits spatial proximity and temporal smoothness.
2.2 Self-supervised Learning
Self-supervised learning is a technique used to develop generalizable and effective data representations, particularly suitable for scenarios with scarce labeled data. Regarding spatiotemporal learning, ST-SSL [Ji et al., 2023] introduces a spatial region clustering task and a time-aware contrastive task with the traffic flow graph to preserve spatial and temporal heterogeneity. SSH-GNN [Han et al., 2022] incorporates neighbor prediction and contextual inference tasks to reduce air quality prediction bias in unmonitored regions. RegionDCL [Li et al., 2023b] employs group-level and regionlevel contrastive learning to adapt to varying region partition tasks. Motivated by these works, we develop a selfsupervised pairwise neighboring relation consistency detection method to preserve the heterogeneity of multi-type relationships, which has not been well explored in existing POI relationship inference methods.
3 Preliminaries and Definitions
This section introduces preliminaries including the dynamic relationship graph composed of POI nodes and relational edges, and the definition of the multi-temporal relationship inference problem.
Definition 1 (POI Node) Each POI node vi = (lati, loni) is associated with a geographical coordinate tuple (i.e., latitude and longitude), which represents its geospatial position.
Definition 2 (Relational Edge) Each edge e(t) i,j = (vi,r,vj ,t) indicates that there is a relationship type r ∈ R between node vi and node vj in time segment t.
Definition 3 (Dynamic Relationship Graph) A dynamic relationship graph is defined as a collection of time-specific graphs G = {G(t) |G(t) = (V,E(t) ), t ∈ [1, T]}, where V = {v1, . . . , vN} is the set of POI nodes with the size of |V | = N, and E = {E(1) , . . . ,E(T) } is the set of relationships. A sequence of T time-specific graphs constitutes the dynamic relationship graph of a full day.
Definition 4 (Triad) A triad is defined as three associated nodes linked by two relationships. To fully capture interactions between relationships, we construct triads from both spatio-temporal view and relationship consistency view. Given a node vi in time segment t, triads are classified into:
where (t, t′ ) represents the transition from time segment t to t′ , r and r′ are two different types of relationships. From the perspective of spatio-temporal view, triads are divided into spatial-spatial and temporal-spatial triads according to space and time. From the perspective of relationship consistency view, triads are divided into consistent and inconsistent relation triads according to the same or different relationship types between adjacent nodes. The construction detail is introduced in Section 4.
Definition 5 (Multi-Temporal Relationship Inference)
Given the dynamic relationship graph G with coordinate information and relationship type, the goal of multi-temporal relationship inference is to learn a predictive function f(V × V | G) that estimates the possibility score for each relationship type of candidate POI pairs.
4 Methodology
This section presents our framework TESTN. As illustrated in Figure 2, TESTN consists of four major components: (1) Spatial 2-hop Aggregation Layer (S2-AGG) and (2) Relational 1-hop Convolution layer (R1-Conv) model spatial and relational correlations within the time segment, (3) Temporal Context Extractor (TC-Extractor) learns from relational graphs of adjacent time segments to obtain rich contextual information, (4) Self-supervised Pairwise Neighboring Relation Consistency Detection (PNRCD) identifies the consistency of relationship types to model the heterogeneity.
4.1 Spatial 2-hop Aggregation Layer
Exploiting the spatial proximity of POIs can effectively enhance the relationship inference, as according to Tobler's first law of geography [Tobler, 1970], near POIs are more related than distant POIs. To enable sparse spatial distances suitable for model learning, we employ the spatial distance embedding module [Xu et al., 2022] to transform the distances into discrete embeddings. Specifically, the entire distance range is divided into multiple disjoint bins (e.g., 0-1km, 1-3km, 37km, etc), and the distances within the bin range are mapped to the same distance embedding di,j by the embedding layer.
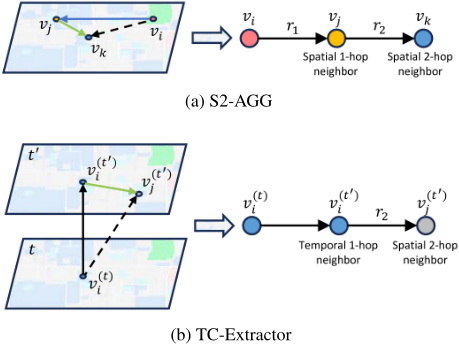
As illustrated in Figure 3a, vk serves as the spatial 2-hop neighbor of vi via vj. Despite the absence of a direct relationship between vk and vi, vk is spatially closer to vi than vj, indicating that 2-hop neighbors may have greater spatial proximity compared to 1-hop neighbors. Furthermore, conventional graph neural networks with two layers are unable to capture this correlation, as information can only propagate along edges. Consequently, the learned distances di,j and dj,k do not have an explicit connection to di,k (unless vj is on the straight path between vi and vk). The neighborhood of S2-AGG is formally defined as:
where r1 and r2 are the relationship type of the spatial 1hop and 2-hop. Therefore, vi, vj, and vk together form a spatial-spatial triad. Different from the SEENet [Li et al., 2023a], which divides and processes second-order neighbors according to first-order and second-order relationship types, our method avoids the problem that the module size grows quadratically with the number of relationship types.
Considering the propagation between nodes from geographical and semantic views, we enhance the Graph Attention layer (GAT) [Veliˇckovi´c et al., 2017] by incorporating the direct distance embedding di,k of 2-hop neighbor vk as the spatial feature and spatial 1-hop neighbor vj as the semantic feature. A pairwise attention score α(t) i,k for 2-hop neighbor vk is calculated as:
where W(t) spa, W(t) sem, and W(t) e are learnable parameters, h(t) spa,i,k and h(t) sem,i,k are spatial and semantic representations. ∥ refers to the concatenation operation. hi, hj, and hk are the input location embeddings, σ is the LeakyReLU function with negative slope of 0.2.
Based on the attention score, we obtain the representations that aggregate spatial context as follows:
4.2 Relational 1-hop Convolution Layer
Relational 1-hop Convolution layer (R1-Conv) is designed for capturing the direct relationship, with the neighborhood of node vi defined as N (t) r (vi) = {vj | (vi, r1, vj, t) ∈ E(t)}, where r1 refers to the relationship type of 1-hop.
Specifically, the feature aggregated from the 1-hop neighbor vj is integrated with the distance embedding di,j, which is represented as:
where W(t) a is the learnable parameters. Then the graph convolution operation can be formulated as follows:
where deg (vi) is the degree of node vi in relationship graph. Then we employ a residual connection in order to preserve the spatial information and mitigate the vanishing gradient problem [He et al., 2016], which is represented as:
4.3 Temporal Context Extractor
Given that human daily schedules typically follow fixed routines with limited movement range in the short term and human behavior relationships show regular and gradual changes in adjacent time segments, Temporal Context Extractor (TCExtractor) is proposed to supplement contextual information in evolving relational patterns.
To this end, we take the representations of the same node at adjacent time segment into account to model the similarities and differences over time. As illustrated in Figure 3b, for the POI node vi in time segment t, TC-extractor takes vi with the same geographical location in the adjacent time segment t′ as temporal 1-hop, and further take vj which is the neighbors of vi in the time segment t′ as the spatial 2-hop. Therefore, the neighborhood of TC-Extractor is formally defined as:
where ϵ is the adjacent segment extraction size and r2 is the relationship type of the spatial 2-hop. Therefore, vi in time segment t and t′ and vj in time segment t′ together form a temporal-spatial triad.
Through TC-extractor, node embedding aggregates the neighborhood within the adjacent interval [t-ϵ, t+ϵ], which can provide additional context for time segment t. Specifically, similar to S2-AGG, TC-Extractor enhances the attention weight computation in GAT by incorporating the distance embedding di,j as the spatial feature and the representation of the same node vi in adjacent time segment t′ as the semantic feature, which is represented as:
where W(t) spa′ , W(t) sem′ , and W(t) e′ are learnable parameters. We employ a multi-head attention mechanism to obtain stable contextual representations of adjacent time segments:
where K is the number of attention heads.
Finally, we utilize time-specific Multi-Layer Perceptron (MLP) to transform the contextual information frommultiple adjacent time segments and merge it with the representation of the current time segment, which is represented as follows:
where W(t) o is learnable parameters of MLP and z(t) i denotes the time-specific embeddings of the model output.
4.4 Pairwise Neighboring Relation Consistency Detection
To acquire the generalized representation, we devise Pairwise Neighboring Relation Consistency Detection (PNRCD) to preserve relational heterogeneity by reinforcing the divergence among multiple relational neighborhoods.
Specifically, we first define the relational neighbors based on the relationship type. The relational neighborhood of type rk is denoted as N (t) r (vi, rk) = {vj | (vi, rk, vj, t) ∈ E(t)}. Then we sample the node from the different relational neighborhoods to construct inconsistent relational triads (vp, vi, vp+), labeled as positive set Dp. In contrast, we sample the node from the same relational neighborhood to construct consistent relational triads (vn, vi, vn-), labeled as negative set Dn. The representation of relational edge between vi and vj is calculated as:
Unlike relationship inference focusing on pairs of nodes, the PNRCD task is targeted at pairs of adjacent edges (i.e., triads). By distinguishing the consistency of relational triads, the PNRCD task is optimized with cross-entropy loss, which is defined as follows:
where g(·) is the discriminator that evaluates the triad-level consistent score through aggregating pairwise relationships with bilinear transformation as follows:
where Wb is learnable parameters of the discriminator. In addition, the divergence of node representation can be effectively enhanced with the auxiliary PNRCD task, thereby alleviating the over-smoothing problem [Li et al., 2018] of graph convolutional networks.
4.5 Prediction Layer
Given a pair of POI (vi, vj), the likelihood score of the existence of a relationship r between two POIs in time segment t can be calculated by the DistMult factorization [Yang et al., 2015] as:
where W(t) r is the learnable parameter for relationship r. We use the cross-entropy loss of predictions ˆ y(t) r,i,j and ground truth y(t) r,i,j as the optimization objective, which is defined as:
(18) where D is the relationship set of training data, y(t) r,i,j = 1 if relationship exist, otherwise y(t) r,i,j = 0.
4.6 Training and Optimization
In order to avoid overfitting and make the model more generalizable, we use random edge sampling to construct a subgraph G ′ of the training set as input during the training epochs. The subgraph construction is formulated as follows:
where G = (V, E) is the whole relationship graph of train set and ω denotes the sampling ratio of edges.
In the training process, the self-supervised PNRCD task is optimized jointly with the relationship inference. Therefore, we have the total loss of the multi-task learning framework as follows:
where λ is the hyper-parameter of the loss function to balance the importance of the main task and self-supervised task.
5 Experiment
To demonstrate the effectiveness of the proposed TESTN, we conduct extensive experiments on three real-world datasets to answer the following research questions (RQs):
- RQ1: How does the proposed TESTN model perform compared with previous studies on multi-temporal POI inference task?
- RQ2: How do different modules of TESTN contribute to model performance?
- RQ3: How do key hyperparameters affect the performance of TESTN?
- RQ4: Can the learned representations provide intuitive visualization to the performance?
| Dataset | Chicago | NYC | Tokyo |
|---|---|---|---|
| Relation Source # Nodes | Bike trip 483 | Check-in 1,548 | Check-in 3,103 |
| # Relations at t1 | 1,059 | 699 | 1,820 |
| # Relations at t2 | 5,894 | 1,024 | 3,991 |
| # Relations at t3 | 6,275 | 1,136 | 9,419 |
| # Relations at t4 | 1,322 | 512 | 1,446 |
| # Relation Sum | 14,550 | 3,371 | 16,676 |
| Average Degree | 60.2 | 4.4 | 10.7 |
| Model | Chicago | NYC | Tokyo | ||||||
|---|---|---|---|---|---|---|---|---|---|
| HR@3 | HR@10 | MRR@10 | HR@3 | HR@10 | MRR@10 | HR@3 | HR@10 | MRR@10 | |
| GCN | 0.1042 | 0.3251 | 0.1076 | 0.2030 | 0.4328 | 0.1683 | 0.1328 | 0.3056 | 0.1315 |
| GAT | 0.1192 | 0.3348 | 0.1150 | 0.2358 | 0.4507 | 0.1876 | 0.1371 | 0.3218 | 0.1284 |
| DGI | 0.1168 | 0.3385 | 0.1176 | 0.2436 | 0.4623 | 0.1904 | 0.1864 | 0.4010 | 0.1643 |
| RGRL | 0.1266 | 0.3569 | 0.1286 | 0.2509 | 0.4769 | 0.2133 | 0.2083 | 0.4182 | 0.1684 |
| ROLAND | 0.1403 | 0.3827 | 0.1302 | 0.2645 | 0.4861 | 0.2090 | 0.2110 | 0.4235 | 0.1772 |
| PRIM | 0.1253 | 0.3672 | 0.1239 | 0.2811 | 0.5040 | 0.2217 | 0.1889 | 0.4074 | 0.1548 |
| SEENet | 0.1652 | 0.4256 | 0.1459 | 0.3402 | 0.5460 | 0.2609 | 0.2512 | 0.4706 | 0.2092 |
| TESTN | 0.1884 | 0.4442 | 0.1638 | 0.3749 | 0.6045 | 0.2766 | 0.2656 | 0.4923 | 0.2040 |
| Model | HR@3 | HR@10 | MRR@10 |
|---|---|---|---|
| w/o S2-AGG | 0.1502 | 0.3698 | 0.1308 |
| w/o TC-Extractor | 0.1762 | 0.3959 | 0.1531 |
| w/o STC | 0.1417 | 0.3565 | 0.1267 |
| w/o PNRCD | 0.1528 | 0.4320 | 0.1461 |
| TESTN | 0.1884 | 0.4442 | 0.1638 |
5.1 Experimental Settings
Dataset. We evaluate the performance on three realworld POI datasets: Chicago 1 , Tokyo and New York City (NYC) 2 [Yang et al., 2014]. We follow the pre-processing approach used in [Li et al., 2023a]. Depending on the data type, the relationships generated by the dataset can be divided into two categories: (1) Mobility-based relational data (Chicago): This dataset contains bike riding data collected for about 6 months in Chicago. We label high-flow and low-flow relationships based on the mobility degree to explore the dynamics of urban mobility. (2) Business-based relational data (Tokyo and NYC): Both datasets contain check-in data collected for about 10 months in Tokyo and NYC. We label the competitive and complementary relationships based on the category of visited POIs to explore the dynamics in business scenarios. In general, we evenly split a day into four time segments: morning (t1), midday (t2), night (t3), and midnight (t4) to obtain time-specific relationships. The statistics of datasets are presented in Table 1.
Baselines. We compare the performance of our model with the following seven baselines: (1) GCN [Kipf and Welling, 2017], (2) GAT [Veliˇckovi´c et al., 2017], (3) DGI [Velickovic et al., 2019], (4) RGRL [Lee et al., 2022], (5) ROLAND [You et al., 2022], (6) PRIM [Chen et al., 2022], (7) SEENet [Li et al., 2023a].
Evaluation Metrics. We adopt top-K Hit Ratio (HR@K) and Mean Reciprocal Ranking (MRR@K) not only to predict whether a relationship exists, but also to accurately rank the potential relationship possibilities.
1 https://divvybikes.com/system-data
2 https://sites.google.com/site/yangdingqi/home/foursquaredataset
Implementation Details. We randomly divide the data with training, validation, and test sets in a ratio of 8:1:1. We use Adam optimizer [Kingma and Ba, 2014] with a learning rate of 0.01 and a dropout rate of 0.2 to train the model. The number of attention heads is set to 4. We implement negative sampling [Mikolov et al., 2013] by randomly replacing a POI in the relationship with a sampled POI. The ratio of positive and negative samples is 1:5. The extraction size of the adjacent segment ϵ is set to 1. The details of the edge sampling ratio ω and the weight loss of the self-supervised task λ are illustrated in Section 5.4.
5.2 RQ1: Overall Performance
Table 2 presents the overall performance of TESTN and baselines with the best results shown in boldface and the second best results shown in underline. According to the results, we can get key observations as follows:
(1) TESTN achieves the best performance in most metrics across all datasets, demonstrating the superiority of our model. In particular, on the Chicago dataset, TESTN surpasses the suboptimal model with ratios of 14.04%, 4.37%, and 12.27% in terms of HR@3, HR@10, and MRR@10, respectively. These results indicate that TESTN is highly effective in identifying and prioritizing relevant POIs among numerous unrelated POIs.
(2) The performance of GCN and GAT that depend solely on the topological structures derived from the relationship graph is unsatisfactory. In contrast, models that integrate spatial information of POIs (i.e., PRIM, SEENet, and TESTN) exhibit a certain performance upgrade over GCN and GAT. Furthermore, SEENet and TESTN which capture evolving patterns gain greater improvement. The performance improvement of our model can be attributed to the multi-task framework for capturing spatio-temporal context and preserving the heterogeneity of multi-type relationships jointly.
(3) It is worth noting that TESTN consistently ranks first on the Chicago dataset with the smallest average degree, as well as on the NYC dataset with the largest average degree. The consistent performance across datasets with varying graph densities validates the robustness of TESTN, highlighting its effectiveness and adaptability in diverse graph structures.
(c) The impact of ω on NYC (d) The impact of λ on NYC
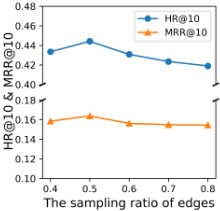
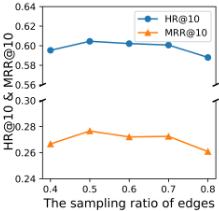
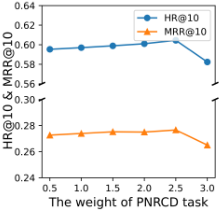
Figure 4: The parameter sensitivity analysis of TESTN.
5.3 RQ2: Ablation Study
To validate the effectiveness of different components in the TESTN model, we perform the ablation study with the following variants: (1) w/o S2-AGG removes the S2-AGG module designed for spatial context extraction, (2) w/o TCExtractor removes the TC-Extractor module designed for temporal context extraction, (3) w/o STC removes S2-AGG and TC-Extractor modules for spatio-temporal context extraction. (4) w/o PNRCD removes the PNRCD module to model the relational heterogeneity. Table 3 presents the experimental results on the Chicago dataset. In general, we can observe that TESTN consistently outperforms all variants, indicating that each component of TESTN contributes to the model. Specifically, w/o S2-AGG and w/o TC-Extractor (combined to form w/o STC variant) deteriorate the performance of TESTN remarkably, which indicates that spatial and temporal context can effectively supplement the scarce relational information. Furthermore, compared to the w/o PNRCD variant, the complete TESTN model exhibits a more significant improvement in HR@3 relative to HR@10. This suggests that more potential relationships are ranked within the top 3, proving that self-supervised PNRCD task enhances the ability to distinguish relationships.
5.4 RQ3: Parameter Sensitivity Analysis
We investigate the parameter sensitivity of TESTN to two crucial hyperparameters: the sampling ratio of edges ω and the loss weight of self-supervised task λ.
Effect of ω. As shown in Figure 4a and 4c, our method achieves the best result with ω = 0.5 on both datasets. A smaller ω results in an overly sparse graph, leading to mul-
(b) SEENet
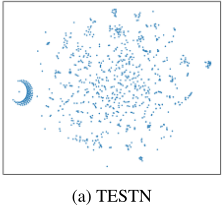
Figure 5: t-SNE visualization of node embeddings on NYC.
tiple disconnected components, which hinders representation learning in graph neural networks. In contrast, a larger ω tends to overfit the training data, reducing the generalizability of the model.
Effect of λ. As shown in Figure 4b and 4d, our method shows the best performance with λ=2 on the Chicago dataset and λ = 2.5 on the NYC dataset. This shows that the contribution of the self-supervised task varies on different datasets. A smaller λ limits the interactions of multi-type relationships. In contrast, a larger λ causes the model to overly focus on triad-level discrimination, leading to a deterioration in relationship inference performance.
5.5 RQ4: Visualization
To investigate the reasons for the superior performance of TESTN compared to the state-of-the-art SEENet method, we employ t-SNE [Van der Maaten and Hinton, 2008] to visualize node embeddings at night (t3) on the NYC dataset. Specifically, we leverage t-SNE to project learned POI node embedding from both models with the same initialization method into a two-dimensional space. As shown in Figure 5, TESTN exhibits more distinct separation between nodes compared to SEENet, and thus relationships derived from node embeddings are more distinguishable, indicating that the problem of oversmoothing [Li et al., 2018; Shen et al., 2024] is alleviated.
6 Conclusion
To the end, we propose a triad-enhanced spatio-temporal network for multi-temporal POI relationship inference, TESTN, that integrates spatial 2-hop aggregation layer and temporal context extractor modules to exploit spatial and temporal contextual information, respectively. To model the heterogeneity of multi-type relationships, a self-supervised pairwise neighboring relation consistency detection method is designed to alleviate the over-smoothing problem. Extensive experimental results on three real-world POI datasets demonstrate the effectiveness of the proposed TESTN model, which validates that addressing investigated challenges contributes to improving the inference capacity of the model.
Acknowledgments
This work was supported by the National Key R&D Program of China 2023YFC3305600, 2024YFE0111800, and NSFC U22B2037 and U21B2046.
@inproceedings{ijcai2025p866,
  title     = {TESTN: A Triad-Enhanced Spatio-Temporal Network for Multi-Temporal POI Relationship Inference},
  author    = {Wang, Hongyu and Chen, Lisi and Shang, Shuo},
  booktitle = {Proceedings of the Thirty-Fourth International Joint Conference on
               Artificial Intelligence, {IJCAI-25}},
  publisher = {International Joint Conferences on Artificial Intelligence Organization},
  editor    = {James Kwok},
  pages     = {7786--7794},
  year      = {2025},
  month     = {8},
  note      = {Main Track},
  doi       = {10.24963/ijcai.2025/866},
  url       = {https://doi.org/10.24963/ijcai.2025/866},
}
TY - CPAPER TI - TESTN: A Triad-Enhanced Spatio-Temporal Network for Multi-Temporal POI Relationship Inference AU - Wang, Hongyu AU - Chen, Lisi AU - Shang, Shuo T2 - Proceedings of the Thirty-Fourth International Joint Conference on Artificial Intelligence, IJCAI-25 PB - International Joint Conferences on Artificial Intelligence Organization PY - 2025 SP - 7786 EP - 7794 DO - 10.24963/ijcai.2025/866 UR - https://doi.org/10.24963/ijcai.2025/866 ER -Copied
Machine-readable versions of this paper, for tools and AI agents:





