
DiffECG: Diffusion Model-Powered Label-Efficient and Personalized Arrhythmia Diagnosis
Proceedings of the Thirty-Fourth International Joint Conference on Artificial Intelligence. Main Track. Pages 8003-8011.
https://doi.org/10.24963/ijcai.2025/890
Keywords
- Machine Learning: ML: Applications
- Machine Learning: ML: Classification
- AI Ethics, Trust, Fairness: ETF: Fairness and diversity
- Multidisciplinary Topics and Applications: MTA: Health and medicine
Abstract
Arrhythmia diagnosis using electrocardiogram (ECG) is critical for preventing cardiovascular risks. However, existing deep learning-based methods struggle with label scarcity and contrastive learning-based methods suffer from false-negative samples, which lead to poor model generalization. Besides, due to inter-subject variability, pre-trained models cannot achieve evenly performance across individuals. Conducting model fine-tuning for each individual is computationally expensive and does not guarantee improvement. We propose DiffECG, a diffusion-based self-supervised learning framework for label-efficient and personalized arrhythmia detection. Our method utilizes a diffusion model to extract robust ECG representations, coupled with a novel feature extractor and a multi-modal feature fusion strategy to obtain a well-generalized model. Moreover, we propose an efficient model personalization mechanism based on zeroth-order optimization. It personalizes the model by tuning the noise-adding step t in the diffusion process, significantly reducing computational costs compared to model fine-tuning. Experimental results show that our proposed method outperforms the SOTA method by 37.9% and 23.9% in generalization and personalization performance, respectively. The source code is available at: https://github.com/Auguuust/DiffEC
- [Akkuzu et al., 2023] Nida Akkuzu, Murat Ucan, and Mehmet Kaya. Classification of multi-label electrocardio- grams utilizing the efficientnet cnn model. In 2023 4th International Conference on Data Analytics for Business and Industry (ICDABI), pages 268-272. IEEE, 2023.
- [Alday et al., 2020] Erick A Perez Alday, Annie Gu, Amit J Shah, Chad Robichaux, An-Kwok Ian Wong, Chengyu Liu, Feifei Liu, Ali Bahrami Rad, Andoni Elola, Salman Seyedi, et al. Classification of 12-lead ecgs: the phys- ionet/computing in cardiology challenge 2020. Physiolog- ical measurement, 41(12):124003, 2020.
- [Association, 2022] American Heart Association. What is an arrhythmia? https://www.heart.org/en/health-topics/ arrhythmia/about-arrhythmia, 2022. Accessed: 2024-07- 25. Link
- [Bousseljot et al., 1995] Ralf Bousseljot, Dieter Kreiseler, and Allard Schnabel. Nutzung der ekg-signaldatenbank cardiodat der ptb über das internet. Biomedical Engineer- ing / Biomedizinische Technik, 1995.
- [Chen et al., 2021] Hui Chen, Guijin Wang, Guodong Zhang, Ping Zhang, and Huazhong Yang. Clecg: A novel contrastive learning framework for electrocardiogram ar- rhythmia classification. IEEE Signal Processing Letters, 28:1993-1997, 2021.
- [Goldberger et al., 2000] Ary L Goldberger, Luis AN Ama- ral, Leon Glass, Jeffrey M Hausdorff, Plamen Ch Ivanov, Roger G Mark, Joseph E Mietus, George B Moody, Chung-Kang Peng, and H Eugene Stanley. Physiobank, physiotoolkit, and physionet: components of a new re- search resource for complex physiologic signals. circu- lation, 101(23):e215-e220, 2000.
- [Haleem et al., 2019] Abid Haleem, Mohd Javaid, and Ibrahim Haleem Khan. Current status and applications of artificial intelligence (ai) in medical field: An overview. Current Medicine Research and Practice, 9(6):231-237, 2019.
- [Hindricks et al., 2010] Gerhard Hindricks, Evgueny Pokushalov, Lubos Urban, Milos Taborsky, Karl-Heinz Kuck, Dmitry Lebedev, Guido Rieger, and Helmut Pu¨rerfellner. Performance of a new leadless implantable cardiac monitor in detecting and quantifying atrial fibril- lation results of the xpect trial. Circulation: Arrhythmia and Electrophysiology, 3(2):141-147, 2010.
- [Holmes et al., 2004] J Holmes, L Sacchi, R Bellazzi, et al. Artificial intelligence in medicine. Ann R Coll Surg Engl, 86:334-8, 2004.
- [Huang et al., 2019] Jingshan Huang, Binqiang Chen, Bin Yao, and Wangpeng He. Ecg arrhythmia classification us- ing stft-based spectrogram and convolutional neural net- work. IEEE access, 7:92871-92880, 2019.
- [Jia et al., 2021] Zhenge Jia, Yiyu Shi, Samir Saba, and Jing- tong Hu. On-device prior knowledge incorporated learning for personalized atrial fibrillation detection. ACM Transac- tions on Embedded Computing Systems (TECS), 20(5s):1- 25, 2021.
- [Jun et al., 2018] Tae Joon Jun, Hoang Minh Nguyen, Daey- oun Kang, Dohyeun Kim, Daeyoung Kim, and Young-Hak Kim. Ecg arrhythmia classification using a 2-d convolu- tional neural network. arXiv preprint arXiv:1804.06812, 2018.
- [Kanna and Eliyas, 2023] DN Kanna and M Mohammed Eliyas. Arrhythmia heart syndrome-a silent killer. Cur- rent Research in Life Sciences, page 15, 2023.
- [Kiyasseh et al., 2021] Dani Kiyasseh, Tingting Zhu, and David A Clifton. Clocs: Contrastive learning of car- diac signals across space, time, and patients. In Inter- national Conference on Machine Learning, pages 5606- 5615. PMLR, 2021.
- [Krasteva et al., 2020] Vessela Krasteva, Sarah Ménétré, Jean-Philippe Didon, and Irena Jekova. Fully convo- lutional deep neural networks with optimized hyperpa- rameters for detection of shockable and non-shockable rhythms. Sensors, 20(10):2875, 2020.
- [Kuznetsov et al., 2020] VV Kuznetsov, VA Moskalenko, and N Yu Zolotykh. Electrocardiogram generation and feature extraction using a variational autoencoder. arXiv preprint arXiv:2002.00254, 2020.
- [Lian et al., 2011] Jie Lian, Lian Wang, and Dirk Muessig. A simple method to detect atrial fibrillation using rr intervals. The American journal of cardiology, 107(10):1494-1497, 2011.
- [Liu et al., 2018] Feifei Liu, Chengyu Liu, Lina Zhao, Xi- angyu Zhang, Xiaoling Wu, Xiaoyan Xu, Yulin Liu, Caiyun Ma, Shoushui Wei, Zhiqiang He, et al. An open access database for evaluating the algorithms of electro- cardiogram rhythm and morphology abnormality detec- tion. Journal of Medical Imaging and Health Informatics, 8(7):1368-1373, 2018.
- [Mehari and Strodthoff, 2022] Temesgen Mehari and Nils Strodthoff. Self-supervised representation learning from 12-lead ecg data. Computers in biology and medicine, 141:105114, 2022.
- [Nakamoto et al., 2022] Mitsuhiko Nakamoto, Satoshi Kodera, Hirotoshi Takeuchi, Shinnosuke Sawano, Susumu Katsushika, K Ninomiya, H Akazawa, and I Komuro. Self-supervised contrastive learning for electrocardio- grams to detect left ventricular systolic dysfunction. In Proceedings of the Annual Conference of JSAI, vol. JSAI2022, pages 1-7, 2022.
- [Petrutiu et al., 2007] Simona Petrutiu, Alan V Sahakian, and Steven Swiryn. Abrupt changes in fibrillatory wave characteristics at the termination of paroxysmal atrial fib- rillation in humans. Europace, 9(7):466-470, 2007.
- [PhysioBank, 2000] PhysioToolkit PhysioBank. Physionet: components of a new research resource for complex phys- iologic signals. Circulation, 101(23):e215-e220, 2000.
- [Pürerfellner et al., 2014] Helmut Pürerfellner, Evgeny Pokushalov, Shantanu Sarkar, Jodi Koehler, Ren Zhou, Lubos Urban, and Gerhard Hindricks. P-wave evidence as a method for improving algorithm to detect atrial fibrillation in insertable cardiac monitors. Heart Rhythm, 11(9):1575-1583, 2014.
- [Rajpurkar et al., 2017] Pranav Rajpurkar, Awni Y Hannun, Masoumeh Haghpanahi, Codie Bourn, and Andrew Y Ng. Cardiologist-level arrhythmia detection with convolutional neural networks. arXiv preprint arXiv:1707.01836, 2017.
- [Sarkar et al., 2017] Shantanu Sarkar, Daniel L Hansen, Grant A Neitzell, Jerry D Reiland, and Ryan Wyszynski. Method and apparatus for atrial arrhythmia episode detec- tion, 2017.
- [Tan and Le, 2019] Mingxing Tan and Quoc Le. Efficient- net: Rethinking model scaling for convolutional neural networks. In International conference on machine learn- ing, pages 6105-6114. PMLR, 2019.
- [Wasimuddin et al., 2021] Muhammad Wasimuddin, Khaled Elleithy, Abdelshakour Abuzneid, Miad Faezipour, and Omar Abuzaghleh. Multiclass ecg signal analysis us- ing global average-based 2-d convolutional neural network modeling. Electronics, 10(2):170, 2021.
- [Xu and Liu, 2020] Xuexiang Xu and Hongxing Liu. Ecg heartbeat classification using convolutional neural net- works. IEEE Access, 8:8614-8619, 2020.
- [Zheng et al., 2020] Jianwei Zheng, Jianming Zhang, Sidy Danioko, Hai Yao, Hangyuan Guo, and Cyril Rakovski. A 12-lead electrocardiogram database for arrhythmia re- search covering more than 10,000 patients. Scientific data, 7(1):1-8, 2020.
References were extracted automatically from the PDF and may contain errors.
Full text extracted automatically from the PDF; figures, tables and equations may differ. The PDF is the version of record.
1 Introduction
Arrhythmia, characterized by irregular heart rhythms, can lead to cardiovascular diseases such as stroke, heart failure, and sudden cardiac arrest [Association, 2022]. Accurate arrhythmia detection is challenging due to its sporadic occurrence and asymptomatic nature. In recent years, deep learning has been widely adopted in arrhythmia detection. Existing approaches leverage either the temporal [Krasteva et al., 2020; Xu and Liu, 2020; Jia et al., 2021] or spectral [Wasimuddin et al., 2021; Jun et al., 2018; Huang et al.,
∗Corresponding author.
- (a) Generalization evaluation.
- (b) Personalization evaluation.
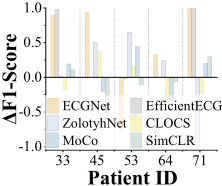
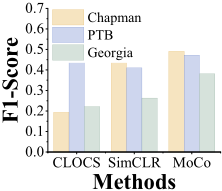
Figure 1: Evaluation results of existing methods. (a) F1 scores on public datasets of models pre-trained with three different selfsupervised learning methods. (b) The changes in F1 scores on individuals of different pre-trained models after being fine-tuned on subject-specific data.
2019] forms of ECG time-series data to train the deep neural network and achieve promising detection performance.
These supervised learning methods generally require extensive data with precise annotations. However, annotating ECG data is labor-intensive and costly. To reduce the dependency on annotations, contrastive learning methods such as CLOCS [Kiyasseh et al., 2021], SimCLR [Mehari and Strodthoff, 2022] and MoCo [Nakamoto et al., 2022] are applied for arrhythmia detection. These methods perform selfsupervised learning by pulling similar sample pairs closer in the feature space while pushing dissimilar pairs apart.
Nevertheless, there are still two main challenges: 1) Existing contrastive learning methods cannot guarantee the satisfactory generalization (ability to perform well on unseen data) of the deep model. The performance of these methods could be impacted by false-negative samples. In contrastive learning, false-negative samples refer to instances of the same category that are incorrectly treated as dissimilar pairs, which are particularly common in arrhythmia detection due to the similarity of ECG patterns across different rhythm types. As shown in Fig. 1(a), the models pre-trained on the large public ECG dataset all achieve F1 scores below 50% when applied to different downstream tasks; 2) The pre-trained models perform unevenly across different individuals due to the intersubject variability in ECG morphological characteristics. A general solution is fine-tuning the pre-trained model using a small portion of an individual's labeled data. However, as shown in Fig. 1(b), existing methods could not achieve improvements across all individuals after fine-tuning.
To address the above challenges, we propose DiffECG, a diffusion-based self-supervised learning framework for labelefficient and personalized arrhythmia detection. While the diffusion model focuses on multi-scale noise prediction rather than classification, we decompose its structure and design a new feature extraction network for downstream arrhythmia detection tasks. Additionally, we design a multi-modal fusion strategy that incorporates temporal, spectral, and domain knowledge to further enhance the model's generalization. To achieve efficient model personalization, we analyze the impact of noise-adding steps t of the diffusion model on individual performance and propose a zeroth-order optimizationbased personalization mechanism. It enhances model personalization by tuning t, greatly reducing computational overhead compared to full model fine-tuning. We evaluate our proposed method on five public ECG datasets and get satisfactory results. In terms of model generalization, the proposed method outperforms existing self-supervised learning approaches by up to 37.9% in F1 score. For model personalization, our method surpasses the SOTA method by 23.9% and 13.9% in F1 score and Accuracy, respectively. The main contributions of the work are summarized as follows:
- We propose DiffECG, a diffusion model-based selfsupervised learning framework for arrhythmia detection, achieving high label efficiency and detection performance.
- We design a new feature extractor structure and a multimodal feature fusion strategy to enhance the model's generalization.
- We investigate the correlation between the noise-adding step t and individual performance, proposing an efficient personalization mechanism that tunes t without extra computation costs.
- Experimental results show that DiffECG surpasses the SOTA method by 37.9% and 23.9% in generalization and personalization performance, respectively.
2 Background
2.1 Arrhythmia and Diagnosis
Arrhythmia is a condition characterized by irregularities in the heart's rhythm, which can show as a heartbeat that is too fast (tachycardia), too slow (bradycardia), or erratic [Kanna and Eliyas, 2023]. Clinicians primarily analyze electrocardiograms (ECGs) or corresponding Lorenz plots to conduct the diagnosis. Lorenz plots could visualize the nature of the variability, which is particularly useful in the study of heart rate dynamics and variability. As shown in Fig. 2(a), the ECG segment contains two heartbeats, each of which consists of a P-wave, a QRS-Complex (consisting of Q-wave, R-peak, and S-wave), and a T-wave. It could also reveal information about the association between heartbeats, such as the RR interval, TP interval, and ST segment.
Cardiologists also use the Lorenz plots, a two-dimensional scatter plot that shows the relationship between successive RR intervals in an ECG, for arrhythmia diagnosis. Each point's coordinate in Lorenz plots is calculated using Equation (1),
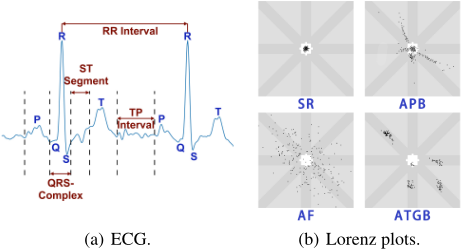
where RRi is defined as a series of RR intervals by locating all R-peaks in the ECG segment. Fig. 2(b) shows the Lorenz plots of four different cardiac rhythms with significant differences in scatter distribution, which could aid cardiologists in diagnosing arrhythmias.
There are automatic arrhythmia diagnostic algorithms based on the above characteristics, such as diagnosing atrial fibrillation based on the pattern of change of RR intervals in the ECG segments [Lian et al., 2011], or furthermore, combining the analysis of P waves [Hindricks et al., 2010; P¨urerfellner et al., 2014]. However, these methods heavily depend on expert and clinical experience, which makes it difficult to obtain the best parameter setting by manual tuning.
2.2 Deep Learning-Based Arrhythmia Detection
Deep learning has been widely adopted to conduct arrhythmia detection due to its ability to train models using only labeled data [Haleem et al., 2019; Holmes et al., 2004], thereby minimizing the dependency on domain-specific expertise. Convolutional neural networks [Rajpurkar et al., 2017; Tan and Le, 2019] and variational autoencoder [Kuznetsov et al., 2020] are used for arrhythmia detection based on features extracted over the temporal form of ECG data.
There are also studies that leverage spectral features from time-frequency analysis for arrhythmia detection [Huang et al., 2019]. Time-frequency analysis refers to examining a non-stationary signal in the frequency domain, enabling a clear description of how the signal's frequency components evolve. The Short-Time Fourier Transform (STFT) is a widely utilized time-frequency analysis method, the process of which can be described by Equation (2),
where X() is a two-dimensional function defined on the time and frequency, x(m) denotes the ECG segment. g() denotes the window function, which is used to reduce spectral energy leakage. The Hanning window is commonly selected as the window function, as shown in Equation (3), where M is the number of sampling points and n is the window length.
In addition, some works adopt self-supervised learning frameworks to reduce the dependency on annotations. Classic contrastive learning methods, such as SimCLR and MoCo, have been applied to ECG signal classification [Mehari and Strodthoff, 2022; Nakamoto et al., 2022]. Other studies design methods based on the unique characteristics of ECG signals. CLOCS [Kiyasseh et al., 2021] introduces a contrastive learning method across space, time, and patients. CLECG [Chen et al., 2021] creates different views of an ECG segment using wavelet transforms and segmented random cropping. Positive samples are obtained from these views, while other segments are used as negative samples for contrastive learning.
3 Methodology
3.1 Diffusion-Based Arrhythmia DetectionModel
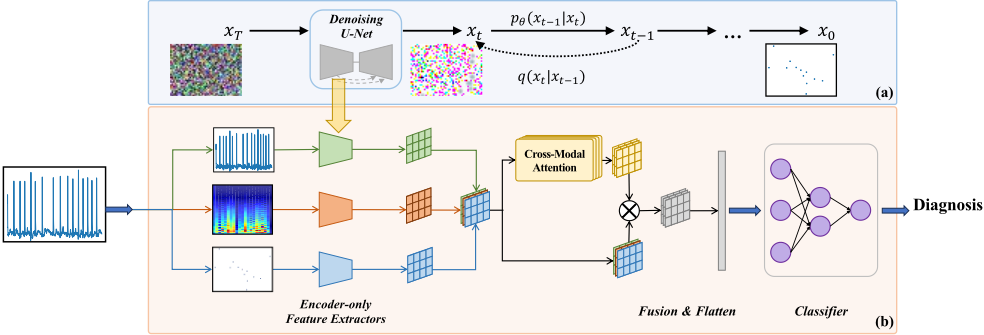
We propose a diffusion-based self-supervised learning framework for accurate arrhythmia detection. As shown in Fig. 3, we first perform self-supervised pre-training on the diffusion model. The denoising network of the diffusion model then serves as a feature extractor for downstream arrhythmia detection tasks, which processes the input data to generate features for a classifier. Our proposed diffusion-based arrhythmia detection model achieves high detection performance with only a few fine-tuning steps while keeping the feature extractor frozen.
The main process of the diffusion model is illustrated in part (a) of Fig. 3. It primarily involves two stages: diffusion and reverse. In the diffusion process, Gaussian noise is gradually added to the input sample x0 by time step t and finally gets xt ∼ N(0, 1), which could be defined by Equation (4),
where β1, ..., βt are some fixed variance schedules. It is worth noting that every noisy sample xt under step t can be directly obtained from the original sample x0 in the diffusion process:
The reverse process of diffusion models transforms noise xT ∼ N(0, I) to the x0 through gradually denoising xT to less noisy samples xt by step t. The reverse process could be defined as follows :
The noise prediction network ϵ(xt, t) in the reverse process predicts the noise added at step t from xt-1 to xt, which typically employs the UNet structure.
In our framework, the input data undergoes a t-step noise addition, where t is a pre-specified hyperparameter. All the noise-added input samples are processed through the UNet for feature extraction.
3.2 Network Structure Search andMulti-Modal Feature Fusion
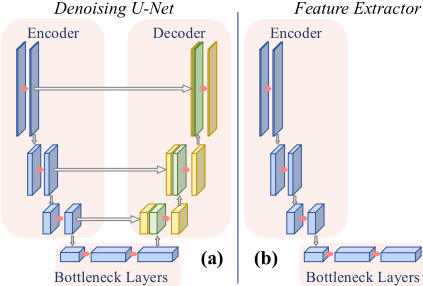
The structure of UNet is illustrated in part (a) of Fig. 4, it comprises a contracting path (encoder), an expanding path (decoder), bottleneck layers, and skip connection structures. This structure efficiently captures features at different granularities. However, it may lead to performance degradation in classification tasks due to the introduction of high-frequency noise and mismatches in semantic abstraction.
To fully utilize the robust feature extraction capabilities of the diffusion model without sacrificing performance, we apply neural architecture search (NAS) to identify the optimal structural configurations. The search space includes multiscale feature extraction modules, hierarchical abstraction layers, and information propagation pathways derived from the original UNet architecture in the diffusion model. Through several optimization cycles, the search algorithm removes redundant components while preserving essential information pathways. This process converges on the optimized structure shown in Fig. 4 (b). The final structure includes the contracting path of the UNet and two bottleneck layers with attention modules, which capture the most abstract and high-level features from the input data while consolidating rich hierarchical features. Since the optimal feature extractor structure identified through NAS can be integrated into a full UNet, we use a UNet with this searched structure as a subnetwork for denoising during the diffusion model training phase. Afterward, we extract the feature extractor's partial parameters and structure for the downstream arrhythmia detection task, eliminating the need for additional model training.
To further enhance the detection performance of the model, we design an attention-based multi-modal feature fusion strategy. As shown in part (b) of Fig. 3, each raw ECG signal segment is transformed into two formats: the spectrogram and the Lorenz plots. The model uses these two formats, along with the original ECG signal segment, as inputs for the proposed diffusion-based arrhythmia detection model. The feature maps from each modality are stacked along the channel dimensions and then weighted and fused by a cross-modal attention module. This approach enables the model to adaptively adjust the weight of each modality for different subjects during the fine-tuning stage.
3.3 t-Based Efficient PersonalizationMechanism
To ensure robust arrhythmia detection across subjects, we analyze the factors influencing the model's detection efficacy. The analysis reveals that the noising-adding step t, which introduces noise to the raw input data, significantly affects detection performance. This effect is particularly pronounced when the sample distribution across different categories is highly imbalanced.
Guided by prior knowledge, performing a grid search for the step t can undoubtedly find the optimal set of t values. However, this approach incurs significant time and computational costs. Therefore, we propose a zero-order optimization-based personalization mechanism, along with an original optimization objective, to determine the optimal set of t values.
Bayesian optimization estimates the probability distribution of the objective function by constructing a surrogate model. It then determines the location of the next evaluation point using an acquisition function. This point is evaluated on the true objective function, and the surrogate model is updated accordingly. The process iteratively continues, gradually converging to the optimal solution.
We employ Gaussian processes as the surrogate function for Bayesian optimization, which is shown as Equation (7):
where m(x) denotes the mean function and k(x, x′ ) denotes the covariance function. In this paper, we choose the Radial Basis Function (RBF) as the covariance function, which could be described as Equation (8):
where ∥x-x′ ∥ denotes the Euclidean distance between x and x′ and l denotes the length scale for the smoothness control of the function.
For the acquisition function, we choose the Expected Improvement (EI) method, which is described as Equation (9):
where x+ denotes the optimal solution position selected by the acquisition function.
Accuracy or F1-score is commonly used as the optimization objective in Bayesian optimization. However, these metrics are not meaningful until the model approaches convergence, which is time-consuming and computationally expensive. Therefore, we propose a new metric, γ, to assess the model's convergence ability based solely on the initial training epochs. This metric is defined as follows:
where the ω denotes the weight parameters of the neural network model (or model itself) and L(ω) denotes the loss function. γ represents the sensitivity of the model's loss value to parameter updates, which intuitively could reflect the model's convergence ability.
Starting from the objective function of neural networks, the feasibility of using γ as the optimization objective is analyzed as follows. Equation (11) shows the optimization object of the neural network,
where ω, denotes the neural network model and L(ω) denotes the loss function. Given that neural networks have a large number of parameters and complex nonlinear transformations, finding their analytical solutions is very difficult. Therefore, it is impossible to directly obtain a set of parameters ω that minimizes the Loss value. Instead, iterative methods could be used. Equation (12) shows the first-order Taylor series approximation to calculate L(ω) at ωr+1:
where ωr represents the model's parameters after rth update. According to the optimization object shown in Equation (11), the loss value should decrease with each iteration, meaning the following inequality holds constant:
Obviously, for Inequality (13) to always hold, ∇L(ωr) and (ωr+1-ωr) must have opposite signs, thus define (ωr+1-ωr)
where the second line of Equation 14 is the definition of the parameter update process in gradient descent, validating the previous derivation. Further, with the combination of Equations (14), (10), and Inequality (13), the γ would be transformed into the following form:
which shows that the proposed γ approximates the paradigm of the gradient, and could reflect the change ratio of the loss function L(ω) in the parameter space. Using γ, we aim to find a set of t values that maximize γ, thereby achieving the largest gradient within 0th to rth training epochs. At this point, the model could approximate the optimal solution in the early phases of training. Compared to using the changes in accuracy, F1-score, loss value, or mixed definitions of these metrics, γ neither requires extensive training epochs for the model to converge nor produce excessively large or small values, making it more reliable for evaluating the model's performance.
4 Experiments
4.1 Experimental Setup
Dataset. We evaluate all the methods based on five public ECG datasets. CPSC [Goldberger et al., 2000; Liu et al., 2018] consists of ECG records with 9 different types of arrhythmias ranging from 6 to 60 seconds.Chapman [Zheng et al., 2020] consists of ECG records with 11 different types of arrhythmias with a 10-second duration for each record. We group these labels into 4 major types suggested by the dataset. PTB [Bousseljot et al., 1995; PhysioBank, 2000] dataset contains 549 records ranging from 1 to 5 seconds. We conduct a binary classification for atrial fibrillation (AF). Georgia [Alday et al., 2020] consists of ECG records with 56 different types of arrhythmias, with a 10second duration for each record. We eliminate the types with the number of data samples under 500 and group the rest into 4 major types suggested by the dataset. The above 4 datasets have rich types of arrhythmia that are suitable for generalization evaluation. LTAF [Petrutiu et al., 2007; Goldberger et al., 2000] includes 84 ECG records of subjects with paroxysmal or sustained AF. Each record has a duration of 24 or 48 hours, which is suitable for long-term detection.
Implementation Details. We conduct experiments to evaluate the generalization and personalization performance of our method. We report the generalization performances in terms of the detection performances achieved by models on the unseen subjects' data. Specifically, we first split each dataset (i.e., CPSC, Chapman, PTB, and Georgia) into finetuning and testing sets subject-wisely (with a splitting ratio of 2:8) to ensure the subject's data is not mixed between the finetuning and testing sets. Next, we pre-train the model using the entire dataset from one source (e.g., CPSC or Chapman) and fine-tune this pre-trained model with the fine-tuning sets of the remaining datasets. During the fine-tuning phase, feature extractors of all self-supervised methods are frozen. Finally, we demonstrate the generalizability of different approaches by evaluating the detection performance of the model on the testing set of each dataset.
We report personalization performance based on the individual detection accuracy achieved by the model when personalized with subject-specific data. Specifically, we first split each subject's data in the LTAF dataset with a 1:9 ratio, using 10% for fine-tuning and 90% for testing. Next, we pre-train all methods on the CPSC dataset and then personalize the detection model using the 10% subject-specific data. The personalized model is then tested on the remaining 90% of each subject's data. The personalization performance is reported in terms of macro accuracy and F1 score.
We use PyTorch for all methods to build networks, train models, and report detection performance. The training is conducted on a server equipped with four NVIDIA RTX 4090 GPUs, an Intel Xeon Platinum 8480+ CPU, and 1 TB of memory.
Baselines. We evaluate the proposed diffusion-based detection method, DiffECG, against 11 different baseline methods. For generalization evaluation, we implement 3 supervised learning methods: ECGNet [Jun et al., 2018], EfficientECG [Akkuzu et al., 2023], ZolotyhNet [Kuznetsov et al., 2020]; and 3 self-supervised learning methods: CLOCS [Kiyasseh et al., 2021], SimCLR [Mehari and Strodthoff, 2022], MoCo [Nakamoto et al., 2022]. To ensure consistency, we integrate the multi-modal feature fusion strategy into other self-supervised learning baseline methods except CLOSC, since it is specifically designed for timedomain data and can only utilize raw ECG as inputs. All self-supervised learning methods adopt the same feature extractor structure as our proposed method. We also evaluate our proposed method using three uni-modal features respectively as the ablation experiments. For personalization evaluation, we implement all the abovementioned methods and 2 additional medical knowledge-based algorithms: VCLEvidence [P¨urerfellner et al., 2014], Pwave-Evidence [Sarkar et al., 2017].
| Methods | CPSC | Chapman | ||||
|---|---|---|---|---|---|---|
| Chapman | PTB | Georgia | CPSC | PTB | Georgia | |
| ECGNet [Jun et al., 2018] | .888 | .546 | .710 | .280 | .530 | .618 |
| EfficientECG [Akkuzu et al., 2023] | .283 | .468 | .161 | .064 | .648 | .182 |
| ZolotyhNet [Kuznetsov et al., 2020] | .656 | .579 | .484 | .304 | .587 | .517 |
| CLOCS [Kiyasseh et al., 2021] | .541 | .289 | .369 | .179 | .546 | .396 |
| SimCLR [Mehari and Strodthoff, 2022] | .761 | .492 | .512 | .158 | .475 | .503 |
| MoCo [Nakamoto et al., 2022] | .556 | .468 | .392 | .264 | .468 | .472 |
| DiffECG (uni-temporal) | .906 | .522 | .627 | .426 | .573 | .594 |
| DiffECG (uni-spectral) | .890 | .544 | .726 | .441 | .521 | .724 |
| DiffECG (uni-domain knowledge) | .788 | .550 | .595 | .273 | .558 | .606 |
| DiffECG | .913 | .598 | .735 | .537 | .599 | .727 |
4.2 Experimental Results
Genelization Performance. Table 1 shows the generalization performance of all methods. When methods are pretrained on CPSC and fine-tuned on the Chapman dataset, where the distribution of arrhythmia types is relatively balanced, almost all methods demonstrate high detection performance. Our proposed DiffECG under the multi-modal feature fusion strategy achieves the best performance with the F1 score of 91.3%. It outperforms other self-supervised learning methods, CLOCS, SimCLR, and MoCo, by 37.2%, 15.2%, and 35.7%, respectively. In contrast, when methods are pretrained on Chapman and fine-tuned on CPSC, all baseline methods show poor performance with F1 scores falling below 50%. This is because the CPSC dataset contains more heart rhythm types than Chapman, which imposes higher generalization demands on the model. In this scenario, our proposed method achieves an F1 score of 53.7% using the multi-modal feature fusion strategy, outperforming other self-supervised learning methods by up to 37.9%.
When fine-tuning on downstream datasets with imbalanced arrhythmia types distributions, some supervised methods exhibited a significant decline in performance. The EfficientECG gets very low F1 scores on the Georgia dataset, specifically 16.1% and 18.2% when pre-trained on CPSC and Chapman. This suggests that in cases of highly unbalanced data, labeling an uneven number of samples can shift from being beneficial for network convergence to a contributing factor in network overfitting towards a specific class of samples. On the other hand, some self-supervised learning-based methods also show significant performance degradation. This is primarily caused by the presence of false-negative samples during the pre-training phase, which limits its feature extraction capability. In contrast, our DiffECG achieves the highest performance among all self-supervised learning methods, surpassing the best-performing self-supervised learning method, SimCLR, by 10.6%, 22.3%, 12.1%, and 22.4% on the PTB and Georgia datasets when pre-trained on CPSC and Chapman, respectively. It is worth noting that our proposed DiffECG outperforms all self-supervised learning baseline methods, even when relying solely on uni-modal features.
| Method | F1 | ACC |
|---|---|---|
| VCL-Evidence [P¨urerfellner et al., 2014] | .649 | .818 |
| Pwave-Evidence [Sarkar et al., 2017] | .384 | .485 |
| ECGNet [Jun et al., 2018] | .769 | .964 |
| EfficientECG [Akkuzu et al., 2023] | .476 | .915 |
| ZolotyhNet [Kuznetsov et al., 2020] | .500 | .649 |
| CLOCS [Kiyasseh et al., 2021] | .566 | .915 |
| SimCLR [Mehari and Strodthoff, 2022] | .607 | .798 |
| MoCo [Nakamoto et al., 2022] | .579 | .911 |
| DiffECG (uni-temporal) | .806 | .992 |
| DiffECG (uni-spectral) | .827 | .987 |
| DiffECG (domain knowledge) | .642 | .948 |
| DiffECG | .846 | .991 |
Personalization Performance. As shown in Table 2, the proposed DiffECG achieves the highest F1 score and demonstrates excellent personalization performance. It surpasses the medical knowledge-based method VCL-evidence by 19.7% in terms of F1 score and 17.3% in terms of accuracy. Notably, both medical knowledge-based methods perform poorly. This is because their parameters require adjustment when employed on different subjects, which heavily rely on domain knowledge and clinical experience. On the other hand, our method also outperforms the other selfsupervised learning methods CLOCS, SimCLR, and MoCo by 28.0%, 23.9%, and 26.7% in terms of the F1 score, respectively.
| t=20 | t=30 | t=40 | t=50 | t=60 | t=70 | γ-opt | |
|---|---|---|---|---|---|---|---|
| F1 | .731 | .730 | .719 | .718 | .714 | .691 | .846 |
| ACC | .950 | .962 | .959 | .955 | .953 | .947 | .991 |
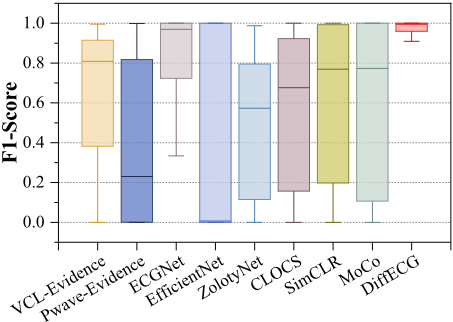
Fig. 5 illustrates the distribution of the F1 scores on all individual subjects of each method. The F1 scores for testing subjects fluctuate between 0% to 100% with both medical knowledge-based methods. While the self-supervised learning baseline methods exhibit higher F1 scores compared to most supervised methods, there remains a large performance gap across subjects. For example, SimCLR achieves the highest lower quartile and median values among them, which are only about 20% and 76%, respectively. In contrast, the proposed DiffECG achieves the best performance, with F1 scores ranging from approximately 91% to 100%, and exhibits the shortest interquartile range, indicating evenly high detection performance across all subjects.
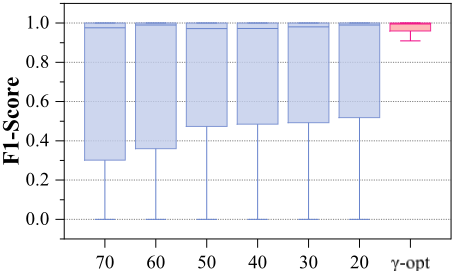
Zeroth-Order Optimization Performance. To validate the original optimization objective-based zero-order optimization strategy, we evaluate the AF detection performance of the proposed DiffECG on the LTAF dataset under different settings of t values. The first six columns of Table 3 show the average F1-scores when the t values of three modalities of all testing subjects are set to the same fixed values of 20, 30, 40, 50, 60, and 70, respectively. The last column shows the average F1-score achieved by using γ as the optimization objective to personalize the t's value for each modality of each testing subject. It is evident that as t (i.e., the noise level) increases, the model's performance shows a downward trend. Compared to the best-performing fixed value of t = 20, our zero-order optimization strategy improves the F1-score by 11.5%. On the other hand, Fig. 6 illustrates the distribution of F1 scores for all testing subjects under different settings of t. The interquartile range shows significant variation across the different settings. Our gamma-based zero-order optimization setup exhibits a notably shorter interquartile range, with even the minimum value being significantly higher than the lower quartile value when t is fixed at 20.
| ∆ACC | ∆ F1 | ∆Loss | ∆Mix | γ | |
|---|---|---|---|---|---|
| F1 | .809 | .807 | .810 | .809 | .846 |
| ACC | .965 | .962 | .969 | .949 | .991 |
In addition, as shown in Table 4, we also evaluate the effect of using different optimization objectives to search for t values. The optimization objectives include the differences in accuracy, F1 score, loss value, and Mix between two epochs, as well as the proposed γ. The Mix is defined as a weighted mixture of the cross-entropy loss function and the F1 score. It is evident that using our proposed γ as the optimization objective achieves the best search results, with the F1 scores higher than the second highest ∆Loss by 3.6%.
5 Conclusion
In this paper, we propose a diffusion-based self-supervised learning framework with an original optimization objectbased zeroth-order optimization strategy to achieve both high label efficiency and personalization performance in arrhythmia detection. The incorporation of the novel feature extractor structure and the multi-modal feature fusion strategy further enhances the detection performance of our proposed method. The proposed diffusion-based model demonstrates strong generalization and personalization performances through evaluation.
Acknowledgments
The work described in this paper is partially supported by Shandong Provincial Natural Science Foundation under Grants ZR2022LZH010, the National Natural Science Foundation of China under Grant U24B20149, and the Taishan Scholars Program under Grant tsqn202408009.
@inproceedings{ijcai2025p890,
  title     = {DiffECG: Diffusion Model-Powered Label-Efficient and Personalized Arrhythmia Diagnosis},
  author    = {Zhou, Tianren and Jia, Zhenge and Yu, Dongxiao and Shen, Zhaoyan},
  booktitle = {Proceedings of the Thirty-Fourth International Joint Conference on
               Artificial Intelligence, {IJCAI-25}},
  publisher = {International Joint Conferences on Artificial Intelligence Organization},
  editor    = {James Kwok},
  pages     = {8003--8011},
  year      = {2025},
  month     = {8},
  note      = {Main Track},
  doi       = {10.24963/ijcai.2025/890},
  url       = {https://doi.org/10.24963/ijcai.2025/890},
}
TY - CPAPER TI - DiffECG: Diffusion Model-Powered Label-Efficient and Personalized Arrhythmia Diagnosis AU - Zhou, Tianren AU - Jia, Zhenge AU - Yu, Dongxiao AU - Shen, Zhaoyan T2 - Proceedings of the Thirty-Fourth International Joint Conference on Artificial Intelligence, IJCAI-25 PB - International Joint Conferences on Artificial Intelligence Organization PY - 2025 SP - 8003 EP - 8011 DO - 10.24963/ijcai.2025/890 UR - https://doi.org/10.24963/ijcai.2025/890 ER -Copied
Machine-readable versions of this paper, for tools and AI agents:





