
A Spatial Missing Value Imputation Method for Multi-view Urban Statistical Data
Proceedings of the Twenty-Ninth International Joint Conference on Artificial Intelligence. Main track. Pages 1310-1316.
https://doi.org/10.24963/ijcai.2020/182
Keywords
- Data Mining: Big Data, Large-Scale Systems
- Data Mining: Applications
- Data Mining: Mining Spatial, Temporal Data
Abstract
Large volumes of urban statistical data with multiple views imply rich knowledge about the development degree of cities. These data present crucial statistics which play an irreplaceable role in the regional analysis and urban computing. In reality, however, the statistical data divided into fine-grained regions usually suffer from missing data problems. Those missing values hide the useful information that may result in a distorted data analysis. Thus, in this paper, we propose a spatial missing data imputation method for multi-view urban statistical data. To address this problem, we exploit an improved spatial multi-kernel clustering method to guide the imputation process cooperating with an adaptive-weight non-negative matrix factorization strategy. Intensive experiments are conducted with other state-of-the-art approaches on six real-world urban statistical datasets. The results not only show the superiority of our method against other comparative methods on different datasets, but also represent a strong generalizability of our model.
- [Atluri et al., 2018] Gowtham Atluri, Anuj Karpatne, and Vipin Kumar. Spatio-temporal data mining: A survey of problems and methods. ACM Computing Surveys (CSUR), 51(4):83, 2018.
- [Candès and Recht, 2009] Emmanuel J Candès and Ben- jamin Recht. Exact matrix completion via convex op- timization. Foundations of Computational mathematics, 9(6):717, 2009.
- [Chen and Liu, 2012] Feng-Wen Chen and Chen-Wuing Liu. Estimation of the spatial rainfall distribution using inverse distance weighting (idw) in the middle of taiwan. Paddy and Water Environment, 10(3):209-222, 2012.
- [Cheng and Lu, 2017] Shifen Cheng and Feng Lu. A two- step method for missing spatio-temporal data reconstruc- tion. ISPRS International Journal of Geo-Information, 6(7):187, 2017.
- [Deng et al., 2016] Dingxiong Deng, Cyrus Shahabi, Ugur Demiryurek, Linhong Zhu, Rose Yu, and Yan Liu. La- tent space model for road networks to predict time-varying traffic. In Proceedings of the 22nd ACM SIGKDD interna- tional conference on Knowledge discovery and data min- ing, pages 1525-1534. ACM, 2016.
- [Gong et al., 2018] Yongshun Gong, Zhibin Li, Jian Zhang, Wei Liu, Yu Zheng, and Christina Kirsch. Network-wide crowd flow prediction of sydney trains via customized on- line non-negative matrix factorization. In Proceedings of the 27th ACM International Conference on Information and Knowledge Management, pages 1243-1252, 2018.
- [Gong et al., 2020] Yongshun Gong, Zhibin Li, Jian Zhang, Wei Liu, and Jinfeng Yi. Potential passenger flow predic- tion: A novel study for urban transportation development. In Proceedings of 34th Conference on AAAI, 2020.
- [Lee and Seung, 2001] Daniel D Lee and H Sebastian Se- ung. Algorithms for non-negative matrix factorization. In Advances in neural information processing systems, pages 556-562, 2001.
- [Li et al., 2018] Yingming Li, Ming Yang, and Zhongfei Mark Zhang. A survey of multi-view rep- resentation learning. IEEE Transactions on Knowledge and Data Engineering, 2018.
- [Liu et al., 2017] Xinwang Liu, Miaomiao Li, Lei Wang, Yong Dou, Jianping Yin, and En Zhu. Multiple kernel k-means with incomplete kernels. In Proceedings of 31th Conference on AAAI, pages 2259-2265, 2017.
- [Murgante and Danese, 2011] Beniamino Murgante and Maria Danese. Urban versus rural: the decrease of agricultural areas and the development of urban zones analyzed with spatial statistics. International Journal of Agricultural and Environmental Information Systems, 2(2):16-28, 2011.
- [Pan and Li, 2010] Liqiang Pan and Jianzhong Li. K-nearest neighbor based missing data estimation algorithm in wire- less sensor networks. Wireless Sensor Network, 2(2):115, 2010.
- [Ranjbar et al., 2015] Manizheh Ranjbar, Parham Moradi, Mostafa Azami, and Mahdi Jalili. An imputation-based matrix factorization method for improving accuracy of collaborative filtering systems. Engineering Applications of Artificial Intelligence, 46:58-66, 2015.
- [Rendle et al., 2009] Steffen Rendle, Leandro Balby Mar- inho, Alexandros Nanopoulos, and Lars Schmidt-Thieme. Learning optimal ranking with tensor factorization for tag recommendation. In Proceedings of the 15th ACM SIGKDD international conference on Knowledge discov- ery and data mining, pages 727-736. ACM, 2009.
- [Singh and Gordon, 2008] Ajit P Singh and Geoffrey J Gor- don. Relational learning via collective matrix factoriza- tion. In Proceedings of the 14th ACM SIGKDD interna- tional conference on Knowledge discovery and data min- ing, pages 650-658. ACM, 2008.
- [Su and Khoshgoftaar, 2009] Xiaoyuan Su and Taghi M Khoshgoftaar. A survey of collaborative filtering tech- niques. Advances in artificial intelligence, 2009, 2009.
- [Tobler, 1970] Waldo R Tobler. A computer movie simulat- ing urban growth in the detroit region. Economic geogra- phy, 46(sup1):234-240, 1970.
- [Trivedi et al., 2010] Anusua Trivedi, Piyush Rai, Hal Daumé III, and Scott L DuVall. Multiview clustering with incomplete views. In The workshop pf 24th Conference on Neural Information Processing Systems, pages 1-7, 2010.
- [Van Buuren, 2018] Stef Van Buuren. Flexible imputation of missing data. CRC press, 2018.
- [Wu and Li, 2013] Tingting Wu and Yingru Li. Spatial inter- polation of temperature in the united states using residual kriging. Applied Geography, 44:112-120, 2013.
- [Xiong et al., 2010] Liang Xiong, Xi Chen, Tzu-Kuo Huang, Jeff Schneider, and Jaime G Carbonell. Temporal collab- orative filtering with bayesian probabilistic tensor factor- ization. In Proceedings of the 2010 SIAM International Conference on Data Mining, pages 211-222. SIAM, 2010.
- [Xu et al., 2015] Chang Xu, Dacheng Tao, and Chao Xu. Multi-view learning with incomplete views. IEEE Trans- actions on Image Processing, 24(12):5812-5825, 2015.
- [Yi et al., 2016] Xiuwen Yi, Yu Zheng, Junbo Zhang, and Tianrui Li. St-mvl: filling missing values in geo-sensory time series data. In Proceedings of 25th International Joint Conference on Artificial Intelligence, pages 2704-2710, 2016.
- [Zheng et al., 2014] Yu Zheng, Licia Capra, Ouri Wolfson, and Hai Yang. Urban computing: concepts, methodolo- gies, and applications. ACM Transactions on Intelligent Systems and Technology, 5(3):38, 2014.
- [Zhou and Huang, 2018] Jingguang Zhou and Zili Huang. Recover missing sensor data with iterative imputing net- work. In Workshops at the Thirty-Second AAAI Confer- ence on Artificial Intelligence, 2018.
References were extracted automatically from the PDF and may contain errors.
Full text extracted automatically from the PDF; figures, tables and equations may differ. The PDF is the version of record.
1 Introduction
Urban statistic data connect social sciences, urban computing, administrative management, transportation, and regional planning that are significant for city development [Murgante and Danese, 2011; Zheng et al., 2014; Gong et al., 2020]. These statistical data usually include multi-fold views (e.g., views of Population and Economy) to reveal the growth gaps among different administrative regions from various perspectives. For example, the economy view records the key economic indicators for fine-grained regions, such as the number of industries and employee statistics; and the population view consists of detailed population information of all age groups in each region.
The statistic data provide key statistics to governments, business and the community on social science, for the benefit of all aspects of human life.
However, in some places, statistical data are hard to be entirely acquired due to document defacement, error recordings, and statistician misplay. Such missing data hide useful information which may cause distorted results for further analysis. To the best of our knowledge, it is still a blank field concerning this specific problem, but the real demand appears. Hence, the missing value imputation for urban statistical data is a vital task for reliable urban computing and government services.
∗Corresponding Author
In this paper, we study the problem of missing-data imputation for the Australian Bureau of Statistics (ABS), which has some unique challenges:
- Missing temporal information. In the real-world data from ABS, almost all the missing values in the current year were also missing in the past years, which may be caused by the region restriction and complicated human-made errors. This violates the basic assumption of matrix completion [Cand`es and Recht, 2009] that the unobserved entries are sampled uniformly at random. Thus matrix completion-based approaches may not work in this case.
- Multi-view problem. The complicated underlying interactions suggest that simply recovering the missing information without considering the correlations among attributes and multi-modes will end up with a poor performance. For example, the economy view has strong correlations with the income and population views, so that a high-quality economy in a region usually goes along with a better income and a larger population; and a low-level economy in a region has a high probability of being connected with a lower income and a smaller population.
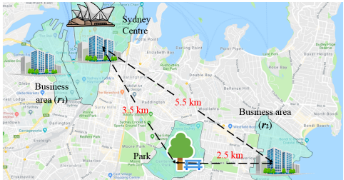
- Spatial correlation mining problem. As illustrated in Fig-
ure 1, the statistical data focusing on fine-grained regions may change over locations significantly and non-linearly. Therefore, to properly recover the missing information of statistical data, we need to consider the regional similarities.
To date, a number of missing data imputation approaches are applied in urban statistical data, e.g., mean-filling (MF), k-nearest-neighbor (KNN) filling [Pan and Li, 2010], and collaborative filtering based methods [Ranjbar et al., 2015]. Most of them, however, have been proposed to focus on the single view problem. Besides, although several spatiotemporal methods can infer the missing information based on the knowledge from both spatial and temporal domains [Yi et al., 2016; Cheng and Lu, 2017; Zhou and Huang, 2018], they do not perform well when the missing temporal information challenge appears. To address all challenges, our proposed method is designed as a spatially related method which can only use spatial information to achieve a strong performance. In detail, the method integrates a spatial multi-kernel clustering method and an adaptive-weight non-negative matrix factorization (NMF) for solving the multi-view spatially related tasks. We summarize the main contributions and innovations of this paper as follows:
- To handle the multi-view problem with spatial characteristic, we propose a Spatially related Multi-Kernel KMeans (S-MKKM) method to identify the underlying relationships among multiple views and capture the regional similarities.
- We propose an adaptive-weight non-negative matrix factorization approach to leverage the information learned above to tackle the multi-view missing data imputation problem. Besides, the proposed method also takes the guidance from the single-view and the real geographic information with KNN strategy into consideration.
- A spatial multi-view missing data imputation method for urban statistical data based on non-negative matrix factorization is proposed, called SMV-NMF. SMV-NMF does not rely on the temporal information but achieves a great performance only using spatial information.
- Our experiments on six real-world datasets verify the effectiveness of our method. All the empirical results show that the proposed method SMV-NMF outperforms all the other state-of-the-art approaches. Furthermore, SMV-NMF shows strong generalizability and can transfer the constructed model from one urban dataset to another well.
2 RelatedWork
2.1 Spatial Missing Data Imputation
Missing data imputation is a significant task for data analysis [Van Buuren, 2018]. In the spatially related problem, neighborhood and collaborative filtering [Su and Khoshgoftaar, 2009; Yi et al., 2016] based methods are two kinds of dominant approaches in missing data filling. Although some classical methods (e.g., zero-filling, mean value filling, regression models) can be applied to the spatial missing data imputation, they have disadvantages in nature, i.e, they are not designed for this spatial problem. [Chen and Liu, 2012]
used the inverse distance weighting (IDW) method to interpolate the spatial rainfall distribution. [Wu and Li, 2013] utilized the spatial information as inputs in a residual kriging method to estimate the average monthly temperature. Unlike the spatial model, some successful spatio-temporal models were proposed for use with time stream data [Yi et al., 2016; Cheng and Lu, 2017; Zhou and Huang, 2018; Atluri et al., 2018]. However, they focused on filling missing entries by considering both spatial and temporal properties, and would not perform well on the static spatial data without the temporal information. Furthermore, these discussed methods leveraged the spatial guidance but did not consider the problem on multi-view datasets.
2.2 Multi-view Learning
Multi-view learning methods involved the diversity of different views that can jointly optimize functions based on various feature subsets [Singh and Gordon, 2008; Li et al., 2018]. [Xu et al., 2015] proposed a matrix co-factorization based method (MVL-IV) to embed different views into a shared subspace, such that the incomplete views can be estimated by the information on observed views. To connect multiple views, MVL-IV assumes that different views have distinct 'feature' matrices (i.e., {Hi}di=1 ), but correspond to the same coefficient matrix (i.e., W). However, it does not exploit the spatial correlations and may suffer from the imbalance problem, i.e., if there is a substantial missing ratio gap between views, the coefficient matrix W is mostly learned from the dense view. In our method, we have addressed this weakness by introducing guidance matrices. Another widely used strategy for solving the multi-view problem is tensor factorization [Rendle et al., 2009; Xiong et al., 2010], but this restricts a regular tensor that requires the number of dimensions per view to be the same. Moreover, multiple kernel learning with incomplete views [Trivedi et al., 2010; Liu et al., 2017] only focuses on completing missing kernels instead of filling missing values. To the best of our knowledge, none of the above studies considered both spatial and multi-view problems. Hence, in this paper, we proposed an effective missing value imputation model for multi-view urban statistical data.
3 The ProposedMethod
3.1 ProblemDescription and Preliminary
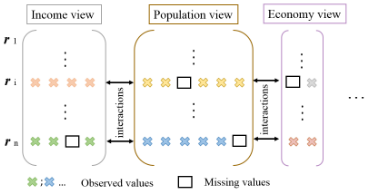
As illustrate in Figure 2, this research focuses on completing the missing values in the urban statistical data, where one urban dataset contains multiple views, e.g., Income, Population, Economy views, etc. For a dataset with n regions (r1,...,rn) and d views, the dimension of attributes in the p-th view is mp (1 ≤ p ≤ d). Our method aims to impute the missing values with a high accuracy.
Multi-view NMF
The multi-view NMF aims to learn a latent subspace W ∈ Rn×k + by multiple views {X1...Xd} through the multi-view generation matrices Hp ∈ Rk×mp + . The basic missing data imputation model can be described as the following optimization objective:
where Yp are indicator matrices whose entry Yp(i, j) is one if Xp(i, j) has been recorded (for observed values) and zero otherwise (for missing values); and ⊙ is the Hadamard product operator.
Multiple Kernel K-means (MKKM)
Let {xi}ni=1 be a collection of n samples (region), xi represents the statistical features of the i-th region, and φp(·) be the p-th view mapping that maps x onto the p-th reproducing kernel Hilbert space. In this case, each sample has multiple feature representations defined by a group of feature mappings φβ(xi) = [β1φ1(xi)⊤, · · · , βdφd(xi)⊤]⊤, where β consists of the coefficients of the d base kernels. A kernel function can be expressed as κβ(xi, xj) = φβ(xi)⊤φβ(xj) = ∑dp=1 β2 p κp(xi, xj). And a kernel matrix Kβ is then calculated by applying the kernel function κβ(·, ·) to {xi}ni=1 . Based on the kernel matrix Kβ, the objective of MKKM can be written as:
where V is the clustering matrix; 1d ∈ Rd is a column vector with all 1 elements; In and Il are identity matrices with size n and l; l is the number of clusters.
3.2 Multi-view Spatial Similarity Guidance
As discussed in Section 2.2, multi-view matrix factorization based methods suffer from the imbalance problem. In this paper, we build the similarity guidance Xmv p for the p-th view Xp to address this problem. Accordingly, we propose an approach to obtain regional similarities via the spatially related MKKM model, called S-MKKM. The basic idea is that the development of a city gradually fosters different functional groups, such as educational and business districts, where the regions belonging to the same group would have strong connections with each other [Zheng et al., 2014]. S-MKKM utilizes the MKKM clustering algorithm combined with a graph Laplacian dynamics strategy (an effective smoothing approach for finding spatial structure similarity [Deng et al., 2016; Gong et al., 2018]) to cluster regions into the functional groups. Specifically, we construct a graph Laplacian matrix L, defined as L = D -M, where M is a graph proximity matrix that is constructed from the regional physical topology (i.e., M(i,j) = 1 if and only if the region xi is contiguous to xj), and D is a diagonal matrix D(i,i) = ∑j (M(i,j)). With this constraint, the S-MKKMmodel is expressed as follows:
where α is the regularization parameter; V is the consensus clustering matrix.
To get the complete kernels, we initially impute the missing data for each view by a simple method, such as KNN or MF. After that, Eq. (3) can be solved by alternately updating V and β: i) With the kernel coefficients β fixed, V can be obtained by choosing the l smallest eigenvectors of (-Kβ +αL). ii) With V fixed, β can be optimized via solving the quadratic programming with linear constraints [Liu et al., 2017].
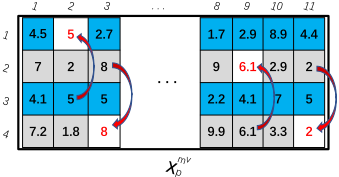
The objective of the S-MKKM is to discover the regions with similar properties and build the guidance matrices Xmv p . After having gotten V , Xmv p can be built. Figure 3 shows an example of this process. The construction process of Xmv p is that i) for the unknown entry xij, and the region xi ∈ c-th cluster, we use its corresponding value xc(i),j from the centroid region to impute xij; ii) if the corresponding value of centroid region is also missed, a greedy strategy will be used to find the nearest observed value for imputation.
3.3 Adaptive-Weight NMF
To learn the knowledge fromXmv p more reliably, we propose an adaptive weighting strategy in the NMF imputation process. The adaptive-weight matrix of the p-th view is denoted as Zp ∈ Rn×mp + , which is built by an exponential function as shown in Eq. (4) and (5).
where Dist(·, ·) is the Euclidean distance calculating from the geo-location (vi) and its corresponding centroid region (vc(i)), here we use the latent embedding vi to represent the geo-location of region i, and vc(i) represents the centroid of the c-th cluster which contains region vi; zp ∈ Rn+ is a column vector and 1mp is all-ones vector with size mp. It is not a straight way for imputation, but the adaptive-weight matrix Zp controls how much information can be extracted. Zp adjusts the penalty of each estimated entry. As emphasised in the First Law of Geography [Tobler, 1970], the near things have more spatial correlations than distant things. If the distance between xi and xc(i) is small, we want a high penalty to guide the imputation process.
Combining the above strategy, our model can be described as the following optimization function:
where ¯ Yp = 1 - Yp, 1 is an all one matrix that has the same size as Yp; Xmv p is a homomorphic matrix of Xp; and λ1 is the regularization parameter to control the learning rate of Xmv p .
3.4 Improved by Single-view and KNNGuidances
S-MKKM aims to find the regional groups by considering multiple views simultaneously. However, it is obvious that each view has its characteristics, and the relationships between regions in one specific view are also critical for imputing missing entries. To consider the above knowledge, we apply the spatially related kernel k-means (S-KKM) to capture the similarities among regions of each view. It is essentially analogous to the learning process of S-MKKM as discussed in section 3.2, but considering each view, respectively. For one viewXp, the S-KKMmodel is expressed as follows:
where Kp is one separate kernel and Vp represents the p-th clustering matrix based on Xp.
In fact, to reduce the complexity of our model, we assume that the physical location affects the clustering performance with the same degree and the number of clusters is the same as that in S-MKKM, i.e., l and α are the same as used in Eq. (3). The reason behind this assumption is that most cities have the same functional regions, such as the residential region and business region. Thus, it is reasonable that we choose the same α and l in this practical task. Besides, α and l are very stable due to the intrinsic property of the urban statistical data, and we fixed them in the experiments. The single view guidance matrix Xsv p and adaptive-weight matrix Z′p can be constructed by the same strategy of building Xmv p and Zp.
Furthermore, for each region, its k-nearest spatial neighbors imply rich information that should be considered in our model. Even though the regional physical topology is already involved in multi-view and single-view learning processes, the KNN is a more flexible method. After structuring Xknn p which is an imputed matrix with the average value of k-nearest neighbors, our final optimization function is shown as follows:
where λ2 and λ3 are the regularization parameters to control the learning rate of Xsv p andXknn p , respectively.
Given the estimated factor matrices W and Hp based on the above update equations, the filled data are given by:
3.5 Learning Algorithm
As Eq. (8) is a non-convex problem, we use the multiplicative update strategy [Lee and Seung, 2001] to ensure the convergence under the following update rules. We first initialize latent space matrices (W and Hp) by decomposing data matrices {X1...Xd}. The update rules for W and Hp are presented in Eq. (10) - (11).
The above two multiplicative update rules guarantee to be non-negative if the initialization is positive. Without this constraint, the matrices W and Hp could be negative, thus the imputation results could be negative too, which is a contradiction to the facts. The process of SMV-NMF is summarized in Algorithm 1.
Time complexity and convergence. We discuss the time complexity and convergence of SMV-NMF here. The time complexity of guidance matrices Xmv p and Xsv p is mainly affected by MKKM. Even though MKKM has a high computational complexity (O(n3 )), it is not involved in update loop of variables (W andHp). Eq. (10) and Eq. (11) present that the time complexity of our final function is governed by matrix multiplication operations in each iteration. Therefore, the
Algorithm 1: SMV-NMF
Input: original data {Xp }; graph Laplacian matrix L.
Output: complete data { ˆ Xp}.
- 1 Impute Xp by KNN for an initialization.
- 2 InitializeW andHp by decomposingXp.
- 3 Construct Xmv p , Xsv p andXknn p by S-MKKM, S-KKM, and KNN respectively.
4 for t = 1 to T do
10 Return ˆ Xp By Eq. (9).
time complexity per iteration is dominated by O(nk2 ). Due to the pursuing of pinpoint accuracy, we sacrifice efficiency to some degree in this real-world problem. In terms of convergence, Algorithm 1 is guaranteed to converge when W or Hp is fixed, because the second-order derivatives regarding W or Hp are positive semi-definite. Thus, the objective function can achieve its optimal value by optimizing W and Hp alternately.
4 Experiments
In this paper, we have conducted complete experiments to demonstrate the effectiveness of our method 1 .
4.1 Datasets
There are six real-world urban statistical datasets (Sydney, Melbourne, Brisbane, Perth, SYD-large, and MEL-large), where -large datasets contain much more fine-grained regions from Australian Bureau of Statistics (2017). Each dataset contains four views, i.e., Economy, Family, Income, and Population. The size of the six datasets are 174, 284, 220, 130, 2230, 1985 respectively. The designation of regions is based on the Australian Statistical Geography Standard for the best practical value. The scales of different views are normalized into the same range [0,10] so that we can evaluate the results together. The numbers of the dimension of the four views are 43, 44, 50, 97, respectively. We choose Australian cities mostly because the Australian Bureau of Statistics provides enough data for our study, while such data from other countries is inaccessible to us. However, our method is general enough and can be applied to other cities with administrative areas and statistical census data. To guarantee the diversity of testing, for each missing ratio, we randomly select the test columns and repeat the experiment 20 times and report average results.
1 The strict proof, resource code, and parameters used to achieve the best performance on different datasets are shown in the https://github.com/SMV-NMF/SMV-NMF.
4.2 Baselines &Measures
Baselines
We compare the proposed method SMV-NMF with the following 12 baselines. All parameters of the proposed method and baselines are optimized by the grid search method.
sKNN: A classical method that uses the average values of its k nearest spatial neighbors as an estimate (k=6).
MKKMIKa ; MKKMIKb: A MKKM based method to handle the incomplete views [Liu et al., 2017]. We modified it to adapt to the spatially related data, then interpolated a missing value by its k nearest spatial neighbors (k=6); Utilize the mean value of each cluster to fill the missing data.
NMF: Fill the missing data by NMF.
IDW: A global spatial learning method compared in many works [Chen and Liu, 2012; Cheng and Lu, 2017].
- UCF: The Local spatial learning method based on collaborative filtering [Su and Khoshgoftaar, 2009; Yi et al., 2016].
IDW+UCF: The average result of IDW and UCF.
- MVL-IV: A state-of-the-art multi-view learning method based on matrix co-factorization, which learns a same coefficient matrix to connect multiple views [Xu et al., 2015].
- ST-MVL: A state-of-the-art method to impute spatiotemporal missing data [Yi et al., 2016]. We only use its spatial part due to the problem of missing temporal information.
- SMV-MF; MV-NMFa ; MV-NMFb: Remove the nonnegativity constraint in SMV-NMF; Remove the graph Laplacian dynamics strategy in SMV-NMF when building the Xmv p andXsv p ; Remove the KNN guidance in SMV-NMF.
Measures. We utilized the most widely used evaluation metrics in our paper, namely Mean Relative Error (MRE) and Root Mean Square Error (RMSE).
where ˆui is a prediction for missing value, and ui is the ground truth; Q is the number of prediction values.
4.3 Results on Urban Statistical Datasets
The first set of experiments is designed to assess performance on each dataset. We pick up half of statistical fields (properties) in each urban dataset randomly as the validation set, and the other half as the test set. In the test set, we randomly select missing ratios from 10% to 70% to evaluate the imputation accuracy.
Table 1 presents the average errors of all missing ratios across different test methods. It is clear show that our approaches (SMV-MF, MV-NMFa , MV-NMFb , SMV-NMF) perform much better than other baselines across different missing ratios on six real-world datasets, where SMV-NMF achieves the best results. Without the non-negativity constraint, SMV-MF performs worse than SMV-NMF, which demonstrates the effectiveness of this constraint. MVL-IV yields better results than ST-MVL, MKKMIKa , IDW+UCF, and NMF becuase it considers the multi-view problem.
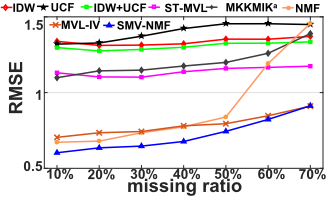
To represent our results more clearly, we pick the top eight methods varying different missing ratios on the Sydney dataset, which is shown in Figure 4. It is apparent that NMF
| Methods | Sydney | Melbourne | Brisbane | Perth | SYD-large | MEL-large | ||||||
|---|---|---|---|---|---|---|---|---|---|---|---|---|
| MRE | RMSE | MRE | RMSE | MRE | RMSE | MRE | RMSE | MRE | RMSE | MRE | RMSE | |
| sKNN | 0.3302 | 1.5319 | 0.3108 | 1.3181 | 0.3534 | 1.4787 | 0.3701 | 1.5754 | 0.2998 | 1.2543 | 0.2635 | 1.1155 |
| MKKMIKb | 0.3281 | 1.5507 | 0.3462 | 1.4635 | 0.3773 | 1.5934 | 0.3986 | 1.6992 | 0.3413 | 1.6112 | 0.3067 | 1.4552 |
| IDW | 0.3321 | 1.5183 | 0.3187 | 1.3188 | 0.3517 | 1.4663 | 0.3724 | 1.5574 | 0.3273 | 1.4992 | 0.3081 | 1.2587 |
| UCF | 0.3566 | 1.6631 | 0.3380 | 1.4635 | 0.3626 | 1.5928 | 0.3757 | 1.6554 | 0.3327 | 1.4230 | 0.3321 | 1.5093 |
| IDW+UCF | 0.3300 | 1.4604 | 0.3141 | 1.3048 | 0.3408 | 1.3967 | 0.3591 | 1.4924 | 0.3045 | 1.2236 | 0.2970 | 1.2111 |
| MKKMIKa | 0.3073 | 1.4393 | 0.2833 | 1.2264 | 0.3167 | 1.3479 | 0.3546 | 1.5066 | 0.2915 | 1.2808 | 0.3019 | 1.2300 |
| NMF | 0.2189 | 1.3841 | 0.1990 | 1.1557 | 0.2225 | 1.3048 | 0.2469 | 1.2866 | 0.2385 | 1.1996 | 0.2032 | 1.0660 |
| ST-MVL | 0.2948 | 1.3137 | 0.2833 | 1.1796 | 0.3117 | 1.2932 | 0.3325 | 1.3949 | 0.2948 | 1.0772 | 0.2829 | 1.1453 |
| MVL-IV | 0.1948 | 1.0603 | 0.1744 | 0.8185 | 0.1970 | 0.9698 | 0.2252 | 1.0676 | 0.1792 | 0.8959 | 0.1834 | 0.9223 |
| SMV-MF | 0.1911 | 0.9360 | 0.1851 | 0.8006 | 0.1832 | 0.8033 | 0.2199 | 0.9647 | 0.1777 | 0.8315 | 0.1922 | 0.9015 |
| MV-NMFa | 0.1806 | 0.9257 | 0.1816 | 0.8159 | 0.1640 | 0.7296 | 0.2170 | 0.9721 | 0.1714 | 0.8226 | 0.1858 | 0.8613 |
| MV-NMFb | 0.1829 | 0.9609 | 0.1738 | 0.8048 | 0.1647 | 0.7703 | 0.2239 | 1.0095 | 0.1681 | 0.8046 | 0.1763 | 0.8124 |
| SMV-NMF | 0.1773 | 0.9084 | 0.1687 | 0.7471 | 0.1574 | 0.7051 | 0.2097 | 0.9347 | 0.1620 | 0.7753 | 0.1692 | 0.7911 |
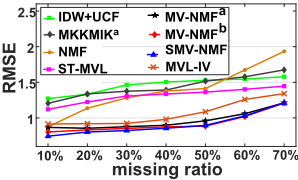
is sensitive to the missing ratio, which could get good results under the lower level missing ratios, but performs worse when the missing ratio increases. Our methods, (SMV-MF, MVNMFa , MV-NMFb , SMV-NMF) have significant improvements compared with current baselines.
Overall, SMV-NMF outperforms the other baselines because it integrates both multi-view and spatial problems to address the specified missing data imputation task. MV-NMFa and MV-NMFb remove a part of the spatial guidance which results in slightly worse performances than SMV-NMF.
4.4 Generalizability Test
We conduct experiments on testing the generalizability in this section. In detail, we choose the dataset Sydney as the validation set and two urban datasets (Melbourne and Brisbane) as the test sets. We report the experimental results on eight available algorithms. SMV-NMF is the most outstanding approach, as shown in Figure 5.
Our method represents strong generalizability which can transfer the constructed model from one urban dataset to another. This is because there are high correlations among cities. For example, the number of functional regions of each city is mostly the same, resulting in the same amount of clusters. The gap between SMV-NMF and MVL-IV narrows as the missing ratio increases, but the former is more robust than the latter because SMV-NMF achieves the best results across all missing ratios. Table 2 reveals the average errors using two evaluation metrics. The generality test demonstrates that our model SMV-NMF is a universal model that performs well crossing different urban statistical datasets.
| Methods | Dataset Melbourne | Dataset Brisbane | ||
|---|---|---|---|---|
| MRE | RMSE | MRE | RMSE | |
| UCF | 0.3311 | 1.4026 | 0.3656 | 1.5624 |
| IDW | 0.3324 | 1.3374 | 0.3697 | 1.4934 |
| IDW+UCF | 0.3182 | 1.3061 | 0.3518 | 1.4552 |
| MKKMIKa | 0.2827 | 1.2018 | 0.3137 | 1.3020 |
| ST-MVL | 0.2794 | 1.1391 | 0.3123 | 1.2698 |
| NMF | 0.1538 | 0.9067 | 0.1781 | 0.9196 |
| MVL-IV | 0.1510 | 0.7879 | 0.1636 | 0.8089 |
| SMV-NMF | 0.1506 | 0.7202 | 0.1493 | 0.6718 |
5 Conclusion
In this paper, we propose a spatial missing data imputation method for multi-view urban statistical data, called SMVNMF. To address the multi-view problem, an improved spatial multi-kernel method is designed to guide the imputation process based on the NMF strategy. Moreover, the spatial correlations among different regions are involved in our method from two perspectives. Firstly, the latent similarities are discovered by S-MKKN and S-KKM based on the idea of finding functional regions, and secondly, KNN is used for capturing the information of real geographical positions. We conduct intensive experiments on six real-world datasets to compare the performance of our model and other state-of-the-art approaches. The results not only show that our approach outperforms all other methods, but also represent strong generalizabilities crossing different urban datasets.
@inproceedings{ijcai2020p182,
  title     = {A Spatial Missing Value Imputation Method for Multi-view Urban Statistical Data},
  author    = {Gong, Yongshun and Li, Zhibin and Zhang, Jian and Liu, Wei and Chen, Bei and Dong, Xiangjun},
  booktitle = {Proceedings of the Twenty-Ninth International Joint Conference on
               Artificial Intelligence, {IJCAI-20}},
  publisher = {International Joint Conferences on Artificial Intelligence Organization},
  editor    = {Christian Bessiere},
  pages     = {1310--1316},
  year      = {2020},
  month     = {7},
  note      = {Main track},
  doi       = {10.24963/ijcai.2020/182},
  url       = {https://doi.org/10.24963/ijcai.2020/182},
}
TY - CPAPER TI - A Spatial Missing Value Imputation Method for Multi-view Urban Statistical Data AU - Gong, Yongshun AU - Li, Zhibin AU - Zhang, Jian AU - Liu, Wei AU - Chen, Bei AU - Dong, Xiangjun T2 - Proceedings of the Twenty-Ninth International Joint Conference on Artificial Intelligence, IJCAI-20 PB - International Joint Conferences on Artificial Intelligence Organization PY - 2020 SP - 1310 EP - 1316 DO - 10.24963/ijcai.2020/182 UR - https://doi.org/10.24963/ijcai.2020/182 ER -Copied
Machine-readable versions of this paper, for tools and AI agents:





