
Learning Sparse Interpretable Features For NAS Scoring From Liver Biopsy Images
Proceedings of the Thirty-First International Joint Conference on Artificial Intelligence. Main Track. Pages 1580-1586.
https://doi.org/10.24963/ijcai.2022/220
Keywords
- Computer Vision: Biomedical Image Analysis
- Machine Learning: Weakly Supervised Learning
- Computer Vision: Interpretability and Transparency
Abstract
Liver biopsy images play a key role in the diagnosis of global non-alcoholic fatty liver disease (NAFLD). The NAFLD activity score (NAS) on liver biopsy images grades the amount of histological findings that reflect the progression of NAFLD. However, liver biopsy image analysis remains a challenging task due to its complex tissue structures and sparse distribution of histological findings. In this paper, we propose a sparse interpretable feature learning method (SparseX) to efficiently estimate NAS scores. First, we introduce an interpretable spatial sampling strategy based on histological features to effectively select informative tissue
regions containing tissue alterations. Then, SparseX formulates the feature learning as a low-rank decomposition problem. Non-negative matrix factorization (NMF)-based attributes learning is embedded into a deep network to compress and select sparse features for a small portion of tissue alterations contributing to diagnosis. Experiments conducted on the internal Liver-NAS and public SteatosisRaw datasets show the effectiveness of the proposed method in terms of classification performance and interpretability. regions containing tissue alterations. Then, SparseX formulates the feature learning as a low-rank decomposition problem. Non-negative matrix factorization (NMF)-based attributes learning is embedded into a deep network to compress and select sparse features for a small portion of tissue alterations contributing to diagnosis. Experiments conducted on the internal Liver-NAS and public SteatosisRaw datasets show the effectiveness of the proposed method in terms of classification performance and interpretability.
- [Arevalo et al., 2014] John Arevalo, Angel Cruz-Roa, and FABIO A GONZ ÁLEZ O. Histopathology image repre- sentation for automatic analysis: A state-of-the-art review. Revista Med, 22(2):79-91, 2014.
- [Chikontwe et al., 2020] Philip Chikontwe, Meejeong Kim, Soo Jeong Nam, Heounjeong Go, and Sang Hyun Park. Multiple instance learning with center embeddings for histopathology classification. In MICCAI, pages 519-528. Springer, 2020.
- [Cordonnier et al., 2021] Jean-Baptiste Cordonnier, Ar- avindh Mahendran, Alexey Dosovitskiy, Dirk Weis- senborn, Jakob Uszkoreit, and Thomas Unterthiner. Differentiable patch selection for image recognition. In CVPR, pages 2351-2360, 2021.
- [Forlano et al., 2020] Roberta Forlano, Benjamin H Mullish, Nikolaos Giannakeas, James B Maurice, Napat Angkathunyakul, Josephine Lloyd, Alexandros T Tzallas, Markos Tsipouras, Michael Yee, Mark R Thursz, et al. High-throughput, machine learning-based quan- tification of steatosis, inflammation, ballooning, and fibrosis in biopsies from patients with nonalcoholic fatty liver disease. Clinical Gastroenterology and Hepatology, 18(9):2081-2090, 2020.
- [Geng et al., 2021] Zhengyang Geng, Meng-Hao Guo, Hongxu Chen, Xia Li, Ke Wei, and Zhouchen Lin. Is attention better than matrix decomposition? ArXiv, abs/2109.04553, 2021.
- [He et al., 2016] Kaiming He, Xiangyu Zhang, Shaoqing Ren, and Jian Sun. Deep residual learning for image recog- nition. In CVPR, pages 770-778, 2016.
- [Heinemann et al., 2019] Fabian Heinemann, Gerald Birk, and Birgit Stierstorfer. Deep learning enables pathologist- like scoring of nash models. Scientific reports, 9(1):1-10, 2019.
- [Jana et al., 2020] Ananya Jana, Hui Qu, Puru Rattan, Car- los D Minacapelli, Vinod Rustgi, and Dimitris Metaxas. Deep learning based nas score and fibrosis stage predic- tion from ct and pathology data. In BIBE, pages 981-986. IEEE, 2020.
- [Katharopoulos and Fleuret, 2019] Angelos Katharopoulos and Franc ¸ois Fleuret. Processing megapixel images with deep attention-sampling models. In ICML, pages 3282- 3291. PMLR, 2019.
- [Lee and Seung, 1999] Daniel D Lee and H Sebastian Seung. Learning the parts of objects by non-negative matrix fac- torization. Nature, 401(6755):788-791, 1999.
- [Lee and Seung, 2000] Daniel D. Lee and H. Sebastian Se- ung. Algorithms for non-negative matrix factorization. In NIPS, 2000.
- [Lin et al., 2021] Huapeng Lin, Xinrong Zhang, Guan- lin Li, Grace Lai-Hung Wong, and Vincent Wai-Sun Wong. Epidemiology and clinical outcomes of metabolic (dysfunction)-associated fatty liver disease. Journal of Clinical and Translational Hepatology, 9(6):972, 2021.
- [Liu et al., 2019] Dongnan Liu, Donghao Zhang, Yang Song, C. Zhang, Fan Zhang, Lauren J O'Donnell, and Wei- dong (Tom) Cai. Nuclei segmentation via a deep panoptic model with semantic feature fusion. In IJCAI, 2019. IJCAI
- [Popa et al., 2021] Stefan Lucian Popa, Abdulrahman Is- maiel, Pop Cristina, Mogosan Cristina, Giuseppe Chiar- ioni, Liliana David, and Dan Lucian Dumitrascu. Non- alcoholic fatty liver disease: Implementing complete auto- mated diagnosis and staging. a systematic review. Diag- nostics, 11, 2021.
- [Puri and Sanyal, 2012] Puneet Puri and Arun J. Sanyal. Nonalcoholic fatty liver disease: Definitions, risk factors, and workup. Clinical Liver Disease, 1, 2012.
- [Roy et al., 2020] Mousumi Roy, Fusheng Wang, Hoang Vo, Dejun Teng, George Teodoro, Alton B Farris, Eduardo Castillo-Leon, Miriam B Vos, and Jun Kong. Deep- learning-based accurate hepatic steatosis quantification for histological assessment of liver biopsies. Laboratory In- vestigation, 100(10):1367-1383, 2020.
- [Taylor-Weiner et al., 2021] Amaro Taylor-Weiner, Harsha Pokkalla, Ling Han, Catherine Jia, Ryan Huss, Chuhan Chung, Hunter Elliott, Benjamin Glass, Kishalve Pethia, Oscar Carrasco-Zevallos, et al. A machine learning ap- proach enables quantitative measurement of liver histology and disease monitoring in nash. Hepatology, 2021.
- [Vahadane et al., 2016] Abhishek Vahadane, Tingying Peng, Amit Sethi, Shadi Albarqouni, Lichao Wang, Maximilian Baust, Katja Steiger, Anna Melissa Schlitter, Irene Espos- ito, and Nassir Navab. Structure-preserving color normal- ization and sparse stain separation for histological images. IEEE transactions on medical imaging, 35(8):1962-1971, 2016.
- [Yin et al., 2021] Chong Yin, Siqi Liu, Rui Shao, and Pong C Yuen. Focusing on clinically interpretable fea- tures: Selective attention regularization for liver biopsy image classification. In MICCAI, pages 153-162.
- [Zhang and Zhou, 2017] Ya-Lin Zhang and Zhi-Hua Zhou. Multi-instance learning with key instance shift. In IJCAI, pages 3441-3447, 2017. IJCAI
- [Zhou et al., 2018] Yanning Zhou, Qi Dou, Hao Chen, Jing Qin, and Pheng-Ann Heng. Sfcn-opi: Detection and fine- grained classification of nuclei using sibling fcn with ob- jectness prior interaction. In AAAI, 2018.
- [Zhou et al., 2021] Yu-Jie Zhou, Feng Gao, Wen-Yue Liu, Grace Lai-Hung Wong, Sanjiv Mahadeva, Nik Raihan Nik Mustapha, Xiao-Dong Wang, Wah-Kheong Chan, Vincent Wai-Sun Wong, and Ming-Hua Zheng. Screening for compensated advanced chronic liver disease using re- fined baveno vi elastography cutoffs in asian patients with nonalcoholic fatty liver disease. Alimentary pharmacology & therapeutics, 54(4):470-480, 2021.
References were extracted automatically from the PDF and may contain errors.
Full text extracted automatically from the PDF; figures, tables and equations may differ. The PDF is the version of record.
1 Introduction
Non-alcoholic fatty liver disease (NAFLD) is a worldwide liver disease. It affects 25% of the global adult population and has raised public concern in recent years [Lin et al., 2021]. Whole slide images (WSIs) of the liver record tissue structures at the cellular level and provide visual insights for monitoring NAFLD progression. The diagnosis of NAFLD requires an estimation of the NAS, which is defined and graded according to the number of three histological findings (e.g., steatosis, inflammation, ballooning) [Puri and Sanyal, 2012]. These histological findings are tissue alterations specific to NAFLD. Accurate NAS provide a quantitative indicator that is important for patient treatment making. Diagnosing NAFLD is laborious, and an increased global prevalence would cause a heavy burden on medical systems.
∗Contact Author
The development of automatic diagnosis systems would be a promising method.
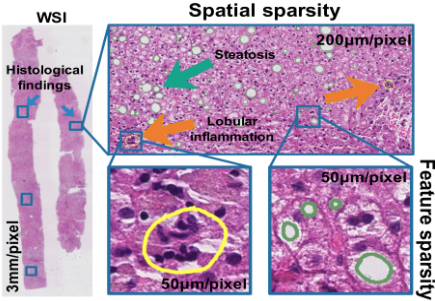
Deep learning methods have achieved promising results in histological image analysis including nuclei segmentation [Liu et al., 2019] and classification [Zhou et al., 2018] on small tissue regions. NAS scoring from whole-slide liver biopsy images remains challenging due to the sparse distribution of histological findings. As shown in Figure 1, it demonstrates the distribution of histological findings in the WSI of the liver. Spatial sparsity: when observing the WSI in a large field of view (3mm/pixel), histological findings (highlighted with a green box) are sparsely distributed on the WSI. Feature sparsity: when zoomed into a small field of view (50 mm/pixel), tissue alterations are mainly represented in features of nuclei (circled in yellow) and fat droplets (circled in green). In addition to the accurate NAS, it is also important to demonstrate histological findings to provide visual evidence for the NAS. In the case that the WSI only has NAS but does not know specific regions of histological findings, the sparse distribution has a higher demand for data utilization efficiency of small medical datasets.
Recently, some works [Forlano et al., 2020; Taylor-Weiner et al., 2021] learn to recognize a small tissue region with histological findings in a supervised manner. It requires pixellevel annotations indicating histological findings. Annotations require expert knowledge and are time-consuming for pathologists, so such annotations are not always available. Instead, [Jana et al., 2020] attempts to release the high requirements for pixel-level annotations and only uses image-level labels to train the model. It adopts ResNet [He et al., 2016] network on the WSI and treats all tissue regions equally. However, not all the tissue regions are equally important for NAS scoring. The model should pay more attention to tissue alteration regions rather than irrelevant normal tissue regions. Furthermore, only estimating the NAS would be criticized for the weak interpretability of the model. Both interpretability and diagnostic accuracy are important in medical image applications. How to learn inherently interpretable models is significant, but rarely studied for this specific task.
Based on the above analysis, how to derive a principle to tackle the sparsity in spatial and feature domains needs further consideration in research. Our basic observation is that histological features (e.g., nucleus and fat droplets) are universal signals associated with tissue alterations. For example, inflammation areas present a high density of nuclei to convey information about tissue alterations, while normal tissue presents evenly distributed nuclei. According to these tissue alteration prior, we can roughly analyze the importance of tissue regions based on the area of histological features. These histological features enable us to perform adaptive sampling to capture tissue regions containing tissue alteration information. Furthermore, tissue alterations in one tissue area are concentrated on nuclei and fat droplets. It is more reasonable to learn sparse features for diagnosis on these tissue structures.
In this paper, we propose a sparse interpretable feature learning method (SparseX) for NAS scoring. Specifically, SparseX introduces histological feature-guided interpretable spatial sampling (ISS) that selects informative tissue regions based on histological features (e.g., fat droplets or nuclei). Histological features are first extracted to provide guidance for importance estimation and selection of tissue alteration regions. Furthermore, we formulate sparse feature learning with non-negative matrix factorization (NMF). An NMF-based attributes learning (SAL) module is embedded into a deep network to learn sparse features from a highdimensional feature space. Our contributions are as follows:
- We propose a sparse interpretable feature learning method (SparseX) that focuses on small but informative tissue regions for NAS scoring from liver biopsy images.
- SparseX introduces histological feature-guided interpretable spatial sampling to adaptively select tissue regions containing tissue alterations based on histological features.
- SparseX formulates feature learning as a low-rank decomposition problem. An NMF-based attributes learning is embedded into the deep network to select features useful for diagnosis.
2 RelatedWork
NAS scoring aims to determine the fatty liver stage from liver biopsy images. It involves grading three histological findings, steatosis, inflammation, and ballooning. In this section, we first present related works focusing on NAS scoring. Next, we review other possible techniques that can be adopted from similar histology image fields to address the sparsity in spatial and feature domains.
NAS Scoring. Some prior studies [Popa et al., 2021] try to solve NAS scoring in two stages. They first build a labeled image tile dataset based on pixel-level annotations. The identification of three histological findings can then be learned in a supervised manner. [Forlano et al., 2020] learns to recognize histological findings through handcrafted features which are carefully designed. Handcrafted features may not tackle the variance in complex tissue structures. [Taylor-Weiner et al., 2021] adopts CNNs for feature extraction. These models rely on pixel-level annotations which are not always available in the medical field. To alleviate the high requirement for dense annotations, some other works focus on developing models which can be trained using data with image-level labels to classify WSIs. [Roy et al., 2020; Heinemann et al., 2019] apply ResNet[He et al., 2016] classification network for NAS estimation. It would be criticized for the weak interpretability of the model. Interpretability and diagnosis accuracy are both important in medical image applications.
Spatial Sparsity. Multiple instances learning [Chikontwe et al., 2020; Zhang and Zhou, 2017] is suitable for solving binary classification problem on WSIs. The slide-level label is determined by the presence or absence of histological findings observed in WSIs. Inn, NAS scoring is a multiclass classification task. Slide-level labels are determined by the number of histological findings which cover a small portion of a WSI. In the field of high-resolution natural image analysis, it is also an important topic that drives the model to focus on a small fraction of image content. The locations of interested regions are selected from the attention distribution introduced in [Katharopoulos and Fleuret, 2019; Cordonnier et al., 2021]. When these methods are applied to liver biopsy images for NAS scoring, the model is unable to handle complex tissue structures, resulting in limited performance.
Feature Sparsity. Low-rank decomposition is theoretically studied in conventional machine learning methods for histological image representation [Arevalo et al., 2014]. [Vahadane et al., 2016] adopts NMF [Lee and Seung, 1999] and decomposes the histological image for color normalization. The ordinary NMF aims to learn a clean feature space while preserving dominant image content. NAS scoring depends on the analysis of sparse histological findings that constitute only a small part of the WSI.
3 ProposedMethod
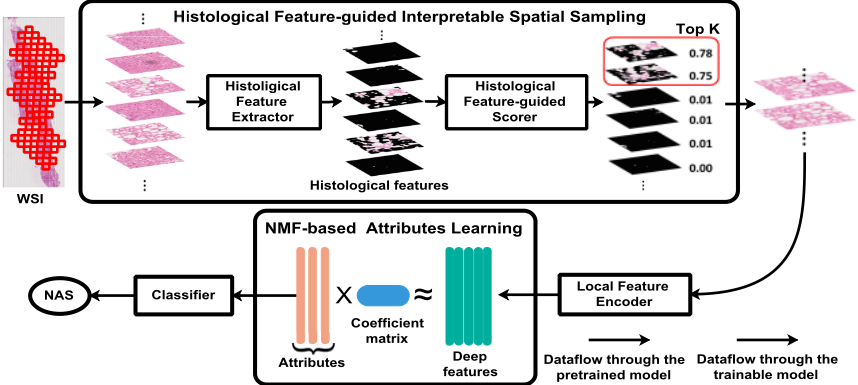
As shown in Figure 2, given a WSI, we propose a sparse interpretable feature learning framework to tackle sparsity in spatial and feature domains. All sliced image tiles are fed into a histological feature extractor to provide guidance for the scorer network to estimate the attention score. Based on the attention score, top k image tiles are selected and processed for feature extraction. Under the sparse assumption, NMF-based attributes learning is embedded into a deep network to select features expressing tissue alterations that are beneficial for diagnosis.
3.1 Histological Feature-guided Interpretable Spatial Sampling
Gigapixel liver biopsy images record cellular-level tissue structures. The diagnosis of NAFLD relies on the analysis of three histological findings which are sparsely distributed the WSI. How to select the interested tissue alteration region is the key to diagnosis. To address the problem, we propose a histological feature-guided interpretable sampling module, which selects tissue regions based on the cues provided by histological features, as shown in the top part of Figure 2.
Given a WSI xi, it is firstly divided into small image tiles {x1i , ..., xji , ..., xni } for computation efficiency. Inspired by [Yin et al., 2021], fat droplets and nuclei pay a key role in indicating regions of tissue alterations. Fat droplets represent areas of tissue alterations associated with steatosis and ballooning. The accumulated nucleus indicate areas associate with inflammation. For each image tile xji , we develop a histological features extractor Eprior based on [Forlano et al., 2020] to get histological features nji :
Histological features nji describe tissue structures and have a correlation with histological findings. The spatial density of these histological features in each tile reflects the likelihood of observing histological findings. A histological featureguided scorer Sθ is developed to estimate an attention score sji :
The score distribution on WSI xi can be represented by si = {s1i , s2i , ..., sni }. The attention score sji reflects the importance of image tile j in slide i. Guided by the attention score, we can determine which parts of the image to retain and which to discard. We select informative tissue regions by differential patch selection TopK [Cordonnier et al., 2021]:
where x′i denotes selected image tiles and x′i = {x1i , x2i , ..., xki }. k refers to the number of selected tiles.
Each tissue tile xji records complex tissue structures. They are further fed into a local feature encoder F to extract l dimensional representation f j i ∈ Rl :
For the slide image xi, the corresponding feature can be represented by a feature combination of selected tiles fi = [f 1 i , f 2 i , ..., f k i ], and fi ∈ Rk×l .
Through histological feature-guided interpretable spatial sampling, the original gigapixel WSI is projected into a more compact feature space. The model attends more to the tissue area that contains tissue alterations.
3.2 NMF-based Attributes Learning
InWSIs, it is challenging to identify features that lead to different disease severity. Due to the high complexity of the tissue structure and high-dimensional feature space, the feature fi may record redundant information irrelevant to the final diagnosis. We consider the problem of sparse feature learning by extending the idea of non-negative matrix factorization.
Given the feature fi represented by a high-dimensional tensor, it can be decomposed into the production of two low-rank metrics ci ∈ Rk× lr and di ∈ Rl× lr by minimizing matrix factorization loss Lnmf :
where R1,R2 are the regularization terms on the rank. The low-rank matrix di ∈ Rl× lr can be interpreted as lr core attributes present in the WSI. The number of columns for ci and di is determined by lr . r is feature compression ratio.
Ordinary NMF aims to remove some noise and maintain the dominant image content. The NMF in Eq 5 approximates the source feature fi with the production cid⊤i . The core attributes di may record dominant tissue information, which is irrelevant to the final diagnosis. Instead of focusing on the large portion of normal tissue structures, we are mainly interested in selecting features describing small portion tissue alterations. The tissue alteration region is often subtle and much less expressed than the most dominant components. The core attribute di should reflect these small small portion of tissue structures that are helpful in diagnosis. We develop a classifier G applied for core attributes di for the final NAS estimation:
| Steatosis | Inflammation | Ballooning | ||||||||||
|---|---|---|---|---|---|---|---|---|---|---|---|---|
| NAS | 0 | 1 | 2 | 3 | 0 | 1 | 2 | 3 | 0 | 1 | 2 | |
| SteatosisRaw | Original | 0 | 9 | 14 | 10 | 5 | 28 | 0 | 0 | 20 | 13 | 0 |
| Combined | 9 | 14 | 10 | 5 | 28 | 20 | 13 | |||||
| Liver-NAS | Original | 0 | 99 | 102 | 64 | 42 | 135 | 84 | 4 | 109 | 140 | 16 |
| Combined | 99 | 102 | 64 | 42 | 135 | 88 | 109 | 156 | ||||
where ˆ yi denotes the predicted label for sample xi.
The corresponding classification loss Lcls is:
To incorporate the supervisory information of NAS yi, we augment the matrix factorization loss Lnmf with classification loss Lcls. So, the final objective function L can be formulated as the combination of two loss terms:
Together with the supervision of classification, the original NMF becomes secondary to the classification task. The supervision would guide the decomposition to discover core attributes that contribute to the disease staging. We apply the Multiplicative Update rules [Geng et al., 2021; Lee and Seung, 2000] to optimize the objective function in an end-to-end manner.
4 Experimental Results
Datasets. We validate the effectiveness of our proposed method on two liver biopsy image datasets. SteatosisRaw [Roy et al., 2020] is a public liver section dataset collected from 33 children. Due to the stain variance related to the tissue preparation and scanning process, all liver tissue sections are stained and normalized into standard H&E. The average image resolution is 30, 000 × 20, 000 by pixel. Liver-NAS [Zhou et al., 2021] is a private dataset of liver biopsy images collected from 265 patients. All liver tissue sections are stained with H&E without normalization processing. The average image resolution is 61, 000 × 20, 000 by pixel.
On both datasets, each WSI is assigned to a discrete NAS by an expert pathologist for quantifying histological findings of steatosis (0-3), inflammation (0-3), and ballooning (0-2). We randomly split all patients into three groups and report the results using 3-fold cross-validation.
Evaluation metrics. We choose specificity, sensitivity and F1 score for evaluation. Each histological finding is evaluated individually using the one-vs-rest strategy.
Data pre-processing. WSIs A large portion of pixels in each WSI belong to the background and contain no information. The tissue region is identified by watershed segmentation [Forlano et al., 2020]. The slide is sliced into nonoverlapping tissue tiles of dimension 256 × 256. Labels As shown in Table 1, the original NAS cannot be used for training because the number of patients in some scores is too small (as shown in 'Original' row). To guarantee there are relatively enough data for learning, we combine some classes and the distribution of new classes are shown in 'Combined' row.
Training details. The histological feature extractor Eprior is implemented with watershed algorithm same as [Forlano et al., 2020]. Histological feature-guided scorer Sθ network consists of 4 Conv2D layers followed by a global average pooling. The pre-trained ResNet-18 [He et al., 2016] is chosen as our local feature encoder F. Following [Jana et al., 2020], only the last residual block is updated for avoiding over-fitting. The model is trained using the Adam optimizer for 30 epochs. The initial learning rate is set to 1e-4 . We adopt a learning rate schedule of exponential decay with power 0.9. The batch size is set to 8 and 2 for two datasets, respectively. We set k = 50 and r = 8 by default.
4.1 ComparisonWith State-of-the-Art Methods
We compare our method against three methods including [Jana et al., 2020] (referred as All-samples), [Cordonnier et al., 2021] (referred as TopK) and [Geng et al., 2021](referred as DeepNMF). All-samples is dedicated to estimating the NAS from the WSI. It treats all image tiles equally for final NAS estimation. Topk is proposed for identifying highdimensional (∼ 960×1280) natural image with simple background. It focuses on selecting a small number of patches from high resolution images for image classification. DeepNMF introduces a deep learning method to implement NMF. We use public available code for our liver biopsy image datasets.
Table 2 shows the NAS estimation results on the public SteatosisRaw dataset. It demonstrates that the proposed method is effective by learning sparse interpretable features. Compared with the method [Heinemann et al., 2019] which uses all samples without having a patch selection procedure (referred as All-samples), the patch sampling-based method [Cordonnier et al., 2021] improves the average F1 score to 74.2% and 74.7% for inflammation and ballooning, respectively. The improvement is benefiting from the selection of a small fraction of the WSI. It improves the efficiency of data utilization. DeepNMF focuses on learning major image content while ignoring tiny tissue alterations, resulting in performance degradation. The introduction of interpretable spatial sampling (ISS) improves the model and increases the average F1 score to 73.1%, 76.7%, 69.9% for steatosis, inflammation, ballooning, respectively. The improvement is because histological features can provide cues to areas of tissue alterations. These cues explicitly drive the model to attend to the informative region for feature learning. When employing NMF-based attributes learning (ISS + SAL), the performance can be further improved , reaching 79.3% and 76.7% for inflammation and ballooning, respectively. We observe a 4.2% reduction in steatosis. The distribution of inflammation and ballooning was more sparse compared to the distribution of steatosis. Sparse feature learning is more suitable for features that contain more redundant information.
| Method | Specificity | Sensitivity | F1 | |||||||
|---|---|---|---|---|---|---|---|---|---|---|
| Steatosis | Inflammation | Ballooning | Steatosis | Inflammation | Ballooning | Steatosis | Inflammation | Ballooning | ||
| All-samples [Jana et al., 2020] | 85.7±4.52 | 69.4±7.86 | 67.8±19.20 | 78.1±4.09 | 69.4±7.86 | 67.8±19.20 | 72.3±6.93 | 71.9±12.51 | 66.0±17.50 | |
| TopK [Cordonnier et al., 2021] | 79.6±7.70 | 71.3±5.24 | 74.9±11.34 | 68.1±10.75 | 71.3±5.24 | 74.9±11.34 | 57.5±19.69 | 74.2±9.20 | 70.5±11.65 | |
| DeepNMF [Geng et al., 2021] | 73.5±12.09 | 69.4±4.54 | 60.0±8.83 | 50.0±23.57 | 69.4±4.54 | 60.0±8.83 | 43.7±28.13 | 70.4±8.00 | 55.2±6.43 | |
| Ours | ISS | 87.6±2.50 | 77.8±3.93 | 80.8±5.14 | 78.0±7.03 | 77.8±3.93 | 80.8±5.14 | 73.1±3.68 | 76.7±5.72 | 74.7±8.03 |
| ISS+SAL | 84.5±1.70 | 88.9±9.07 | 79.3±5.99 | 73.9±7.13 | 88.9±9.07 | 79.3±5.99 | 68.8±3.61 | 79.3±16.11 | 76.7±3.13 | |
| Specificity | Sensitivity | F1 | ||||||||
|---|---|---|---|---|---|---|---|---|---|---|
| Method | Steatosis | Inflammation | Ballooning | Steatosis | Inflammation | Ballooning | Steatosis | Inflammation | Ballooning | |
| All-samples [Jana et al., 2020] | 86.4±1.75 | 75.6±0.94 | 66.0±2.15 | 73.0±3.36 | 57.2±1.67 | 66.0±2.15 | 72.2±3.29 | 49.4±5.14 | 64.7±2.33 | |
| TopK [Cordonnier et al., 2021] | 86.0±0.88 | 75.1±1.25 | 62.8±3.24 | 71.2±1.57 | 56.6±3.01 | 62.8±3.24 | 71.7±1.16 | 50.8±6.63 | 62.9±3.23 | |
| DeepNMF [Geng et al., 2021] | 85.2±0.63 | 74.9±0.81 | 65.9±3.24 | 70.3±1.47 | 52.8±3.82 | 65.9±3.24 | 69.3±1.15 | 49.7±4.21 | 64.0±1.85 | |
| Ours | ISS | 87.5±1.00 | 76.2±2.43 | 70.3±3.99 | 75.6±1.94 | 53.7±3.86 57.5±1.41 | 70.3±3.99 | 74.6±2.24 | 55.2±4.31 | 69.9±3.87 70.8±3.60 |
| ISS+SAL | 86.6±0.86 | 77.0±1.36 | 71.2±3.63 | 73.6±2.75 | 71.2±3.63 | 73.4±1.89 | 56.8±1.57 | |||
When conducting experiments on the more challenging Liver-NAS dataset, which preserves the stain variance. We observe a similar performance, as shown in Table 3. The performance on inflammation produced by TopK method is even close to that of All-samples. We observe a little performance drop on steatosis and ballooning. This may be caused by staining variance preserved in Liver-NAS dataset. This makes it more difficult to select information-rich tissue regions in small dataset. In contrast, we see our sparse interpretable feature learning is independent of the datasets and can bring consistent improvement. The introduction of ISS improves the performance to 74.6%, 55.2%, and 69.9%, respectively. When adopting NMF-based attributes learning (ISS + SAL), the performance can be further improved and reach 56.8% and 70.8% on inflammation and ballooning, respectively. Compared with the improvement on the SteatosisRaw dataset, the effect of SAL is not so great on the LiverNAS dataset. SAL is parameter efficient and it is more capable of showing its capabilities without a large number of samples.
4.2 Attention Distribution
To better understand the benefits of introducing histological features, we plot the distribution of attention scores and compare them with the scores produced by TopK.
As shown in Figure 3, the first row shows the attention score distribution with respect to steatosis. Compared to the attention score distribution produced by TopK (left), our attention score distribution (right) better reflects the observed sparsity of histological findings in WSIs. TopK has a narrow distribution with a high mean and small deviation. Each tissue region has a large attention score. In contrast, our method can produce an attention distribution with a low mean value and large deviation. Benefiting from histological features, our method can better distinguish the type of tissue region from the complex tissue structure.
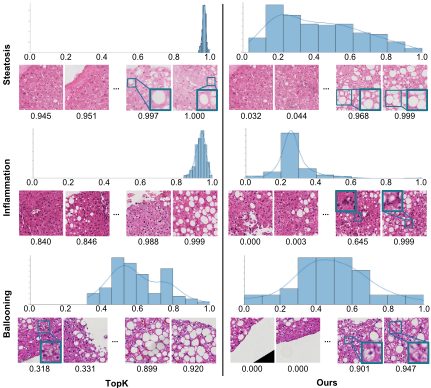
Moreover, four tissue tiles are displayed at the bottom of the figure. They represent the two most important tiles and the two least important tiles, as determined by the estimated attention score. The attention score estimated by our method can better reflect the probability of histological findings observed in the tissue region. The white region represents the steatosis cell. In the tile with an attention score of 0.999, we observe a large portion of steatosis cells. We find a similar attention score distribution pattern for inflammation (2nd row) and ballooning (3rd row). Histological findings of interest (highlighted with bounding boxes) can be observed in image tiles with a larger attention score produced by our method. But no similar pattern is observed in the attention score generated by TopK. The reason is that histological features have a strong correlation with histological findings.
To show that our proposed model indeed learns to focus on histological findings for NAS scoring, we visualize the learned attention distribution on liver biopsy images. For reference, we use a rectangular area with an attention score of 1.0 to highlight the area containing histological findings pointed out by pathologists (referred as GroundTruth in the 2nd column). We compare qualitatively our learned attention distribution between the TopK method (referred to as TopK
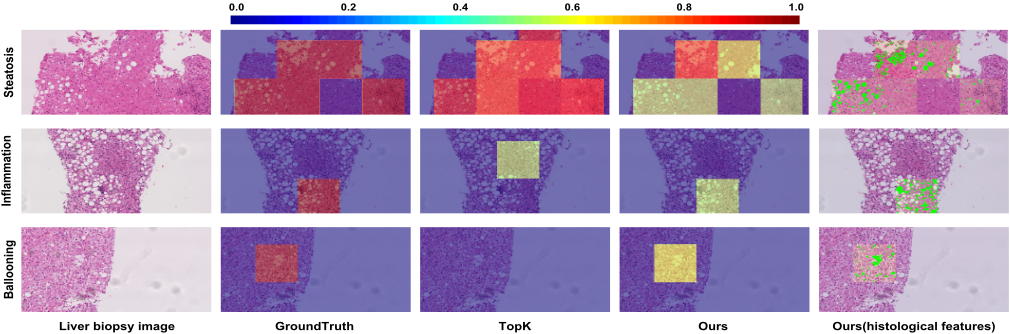
in the 3rd column) and ours (referred as Ours in the 4th column). The extracted histological features of the tissue region highlighted by attention maps are rendered in the 5th column (referred as Ours(histological features)). As shown in Figure 4, our learned attention map matches well with the distribution of histological findings. This reflects that histological features indeed help drive the model to focus on tissue alterations and improve the interpretability of the model.
5 Ablation Study on Sparsity
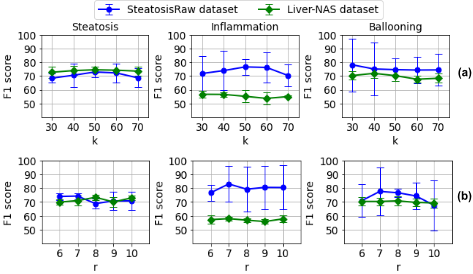
We conduct ablation experiments on two datasets to demonstrate the effect of sparsity in spatial and feature domains, as shown in Figure 5. The number of selected image tiles k and the feature compression ratio r in feature space are two important hyper-parameters in our learning framework. These two hyper-parameters determine the sparsity in spatial and feature domains, respectively. To study the effects of sparsity on estimating NAS, we vary the number of selected tiles k = {30, 40, 50, 60, 70} and feature compression ratio r = {6, 7, 8, 9, 10} in feature dimension. All other settings are the same. We report the average F1 score using 3-fold cross-validation.
Figure 5(a) shows the results with varying number k of selected image tiles. A larger k means selecting more patches for following feature learning. The same tissue alteration type shows slightly different sparsity under two datasets. For steatosis, as the value of k increases, F1 score gradually increases. When we continue to increase the value of k, the effect would decrease. Sampling fewer patches results in loss of informative tissue regions. Sampling more patches results in preserving lots of redundant information. We observe that k = 50 achieves the best result because it balances the relationship between sparsity and the amount of information in selected tissue regions. For inflammation, the performance peaks for the two datasets are 50 and 30, respectively. Different histological findings also have different degrees of sparsity under the same dataset. On the Liver-NAS dataset, the performance peaks for the three histological findings are 50, 30, and 40, respectively. It is consistent with varying degrees of sparsity.
Figure 5(b) shows the results of learning features under different feature compression ratios r. There is no simple linear relationship between the feature compression ratio r and the performance measured by the F1 score. Experiments show that feature sparsity has a greater impact on the smaller SteatosisRaw dataset. Future work may consider this different sparsity to further improve model performance.
6 Conclusion
In this paper, we present a sparse interpretable feature learning method (SparseX) for NAS scoring from liver biopsy images. To tackle the sparse histological findings observed in the spatial and feature domains, histological featureguided interpretable spatial sampling and NMF-based attributes learning are introduced for informative tissue region selection and core attributes learning. Experimental results show the effectiveness of the proposed method in terms of classification performance and interpretability.
Acknowledgements
This work was supported by the Health and Medical Research Fund Project under Grant 07180216.
@inproceedings{ijcai2022p220,
  title     = {Learning Sparse Interpretable Features For NAS Scoring From Liver Biopsy Images},
  author    = {Yin, Chong and Liu, Siqi and Wong, Vincent Wai-Sun and Yuen, Pong C.},
  booktitle = {Proceedings of the Thirty-First International Joint Conference on
               Artificial Intelligence, {IJCAI-22}},
  publisher = {International Joint Conferences on Artificial Intelligence Organization},
  editor    = {Luc De Raedt},
  pages     = {1580--1586},
  year      = {2022},
  month     = {7},
  note      = {Main Track},
  doi       = {10.24963/ijcai.2022/220},
  url       = {https://doi.org/10.24963/ijcai.2022/220},
}
TY - CPAPER TI - Learning Sparse Interpretable Features For NAS Scoring From Liver Biopsy Images AU - Yin, Chong AU - Liu, Siqi AU - Wong, Vincent Wai-Sun AU - Yuen, Pong C. T2 - Proceedings of the Thirty-First International Joint Conference on Artificial Intelligence, IJCAI-22 PB - International Joint Conferences on Artificial Intelligence Organization PY - 2022 SP - 1580 EP - 1586 DO - 10.24963/ijcai.2022/220 UR - https://doi.org/10.24963/ijcai.2022/220 ER -Copied
Machine-readable versions of this paper, for tools and AI agents:





