
Can Abnormality be Detected by Graph Neural Networks?
Proceedings of the Thirty-First International Joint Conference on Artificial Intelligence. Main Track. Pages 1945-1951.
https://doi.org/10.24963/ijcai.2022/270
Keywords
- Data Mining: Mining Graphs
- Data Mining: Networks
Abstract
Anomaly detection in graphs has attracted considerable interests in both academia and industry due to its wide applications in numerous domains ranging from finance to biology. Meanwhile, graph neural networks (GNNs) is emerging as a powerful tool for modeling graph data. A natural and fundamental question that arises here is: can abnormality be detected by graph neural networks?
In this paper, we aim to answer this question, which is nontrivial. As many existing works have explored, graph neural networks can be seen as filters for graph signals, with the favor of low frequency in graphs. In other words, GNN will smooth the signals of adjacent nodes. However, abnormality in a graph intuitively has the characteristic that it tends to be dissimilar to its neighbors, which are mostly normal samples. It thereby conflicts with the general assumption with traditional GNNs. To solve this, we propose a novel Adaptive Multi-frequency Graph Neural Network (AMNet), aiming to capture both low-frequency and high-frequency signals, and adaptively combine signals of different frequencies. Experimental results on real-world datasets demonstrate that our model achieves a significant improvement comparing with several state-of-the-art baseline methods.
- [Balcilar et al., 2021] Muhammet Balcilar, Guillaume Ren- ton, Pierre Héroux, Benoit Gaüzère, Sébastien Adam, and Paul Honeine. Analyzing the expressive power of graph neural networks in a spectral perspective. In ICLR, 2021.
- [Bruna et al., 2014] Joan Bruna, Wojciech Zaremba, Arthur Szlam, and Yann LeCun. Spectral networks and locally connected networks on graphs. In ICLR, 2014.
- [Defferrard et al., 2016] Michaël Defferrard, Xavier Bres- son, and Pierre Vandergheynst. Convolutional neural net- works on graphs with fast localized spectral filtering. In NIPS, 2016.
- [Ding et al., 2019] Kaize Ding, Jundong Li, Rohit Bhanushali, and Huan Liu. Deep anomaly detection on attributed networks. In SDM, 2019.
- [Ding et al., 2021] Kaize Ding, Qinghai Zhou, Hanghang Tong, and Huan Liu. Few-shot network anomaly detec- tion via cross-network meta-learning. In WWW, 2021.
- [Dou et al., 2020] Yingtong Dou, Zhiwei Liu, Li Sun, Yu- tong Deng, Hao Peng, and Philip S. Yu. Enhancing graph neural network-based fraud detectors against camouflaged fraudsters. In CIKM, 2020.
- [Hamilton et al., 2017] William L. Hamilton, Zhitao Ying, and Jure Leskovec. Inductive representation learning on large graphs. In NIPS, 2017.
- [He et al., 2021] Mingguo He, Zhewei Wei, Zengfeng Huang, and Hongteng Xu. Bernnet: Learning arbitrary graph spectral filters via bernstein approximation. In NIPS, 2021.
- [Hu et al., 2020] Wenjie Hu, Yang Yang, Jianbo Wang, Xuanwen Huang, and Ziqiang Cheng. Understanding electricity-theft behavior via multi-source data. In WWW, 2020.
- [Jeffreys and Jeffreys, 1999] Harold Jeffreys and Bertha Jef- freys. Methods of Mathematical Physics. Cambridge Mathematical Library. Cambridge University Press, 3 edi- tion, 1999.
- [Kipf and Welling, 2017] Thomas N. Kipf and Max Welling. Semi-supervised classification with graph convolutional networks. In ICLR, 2017.
- [Li et al., 2019] Ao Li, Zhou Qin, Runshi Liu, Yiqun Yang, and Dong Li. Spam review detection with graph convolu- tional networks. In CIKM, 2019.
- [Liu et al., 2019] Ziqi Liu, Chaochao Chen, Longfei Li, Jun Zhou, Xiaolong Li, Le Song, and Yuan Qi. Geniepath: Graph neural networks with adaptive receptive paths. In AAAI, 2019.
- [Liu et al., 2020] Zhiwei Liu, Yingtong Dou, Philip S. Yu, Yutong Deng, and Hao Peng. Alleviating the inconsis- tency problem of applying graph neural network to fraud detection. In SIGIR, 2020.
- [McPherson et al., 2001] Miller McPherson, Lynn Smith- Lovin, and James M. Cook. Birds of a feather: Homophily in social networks. Review of Sociology, 2001.
- [Qian et al., 2011] Weikang Qian, Marc D. Riedel, and Ivo G. Rosenberg. Uniform approximation and bernstein polynomials with coefficients in the unit interval. Eur. J. Comb., 2011.
- [Rayana and Akoglu, 2015] Shebuti Rayana and Leman Akoglu. Collective opinion spam detection: Bridging re- view networks and metadata. In SIGKDD, 2015.
- [Shuman et al., 2013] David I. Shuman, Sunil K. Narang, Pascal Frossard, Antonio Ortega, and Pierre Van- dergheynst. The emerging field of signal processing on graphs: Extending high-dimensional data analysis to net- works and other irregular domains. IEEE Signal Process- ing Magazine, 2013.
- [Veličković et al., 2018] Petar Veličković, Guillem Cucurull, Arantxa Casanova, Adriana Romero, Pietro Liò, and Yoshua Bengio. Graph attention networks. In ICLR, 2018.
- [Wang et al., 2019] Daixin Wang, Yuan Qi, Jianbin Lin, Peng Cui, Quanhui Jia, Zhen Wang, Yanming Fang, Quan Yu, Jun Zhou, and Shuang Yang. A semi-supervised graph attentive network for financial fraud detection. In ICDM, 2019.
- [Weber et al., 2019] Mark Weber, Giacomo Domeniconi, Jie Chen, Daniel Karl I. Weidele, Claudio Bellei, Tom Robin- son, and Charles E. Leiserson. Anti-money laundering in bitcoin: Experimenting with graph convolutional networks for financial forensics. KDD Workshop on Anomaly Detec- tion in Finance, 2019.
- [Wu et al., 2019] Felix Wu, Tianyi Zhang, Amauri Holanda de Souza, Christopher Fifty, Tao Yu, and Kilian Q. Wein- berger. Simplifying graph convolutional networks. In ICML, 2019.
- [Xu et al., 2018] Keyulu Xu, Weihua Hu, Jure Leskovec, and Stefanie Jegelka. How powerful are graph neural net- works. In ICLR, 2018.
- [Xu et al., 2022a] Jiarong Xu, Junru Chen, Yang Yang, Yizhou Sun, Chunping Wang, and Jiangang Lu. Un- supervised adversarially-robust representation learning on graphs. In AAAI, 2022.
- [Xu et al., 2022b] Jiarong Xu, Yizhou Sun, Xin Jiang, Yan- hao Wang, Yang Yang, Chunping Wang, and Jiangang Lu. Blindfolded attackers still threatening: Strict black-box adversarial attacks on graphs. In AAAI, 2022.
- [Yang et al., 2019] Yang Yang, Yuhong Xu, Chunping Wang, Yizhou Sun, Fei Wu, Yueting Zhuang, and Ming Gu. Understanding default behavior in online lending. In CIKM, 2019.
- [Yang et al., 2021] Yang Yang, Yuhong Xu, Yizhou Sun, Yuxiao Dong, Fei Wu, and Yueting Zhuang. Mining fraud- sters and fraudulent strategies in large-scale mobile social networks. IEEE Transactions on Knowledge and Data En- gineering, 2021.
References were extracted automatically from the PDF and may contain errors.
Full text extracted automatically from the PDF; figures, tables and equations may differ. The PDF is the version of record.
1 Introduction
Detecting anomalies has attracted great research interests, with applications of great impact in numerous domains, such as telecommunication fraud detection [Yang et al., 2021] and theft behavior detection [Hu et al., 2020]. The nature of anomalies could exhibit themselves as inter-dependent, such as mining fake reviews in user-rating-product relations, recognizing the fraudsters on telecommunications network, and detecting money-laundering rings in trading networks. Graph data becomes ubiquitous as a powerful machinery to represent the inter-dependencies by the edges between the related instances. However, the unique characteristics of graph-based data bring additional challenges. The complex correlation in real-world datasets makes it challenging to identify the anomalies from graph objects. Detecting anomalies in graph data is a substantially more complex problem than anomaly detection in a non-relational feature space.
∗Authors contributed equally.
†Corresponding author.
1 The code is available at https://github.com/zjunet/AMNet
Recently, the advance of graph nerual networks (GNNs) has prompted various attempts to adopt GNNs for graphbased anomaly detection [Wang et al., 2019; Liu et al., 2019; Dou et al., 2020; Liu et al., 2020]. The general intuition of GNN-based anomaly detection is to leverage the expressive power of GNNs to learn node representations, aiming at distinguishing anomalous nodes from normal ones in the embedding space. Some recent studies [Wu et al., 2019; Balcilar et al., 2021], however, show that the expressive power of most GNN models is limited to only low-pass filters, which intensify low-frequency signals (more smooth signals) and suppress high-frequency signals (more oscillating signals). The nature of GNNs as low-pass filters succeed as most real-world networks in the real world follow the homophily assumption, where nodes with similar features tend to connect with each other [McPherson et al., 2001]. However, this assumption may be weakened in networks containing anomalies: normal nodes still tend to share common features with their normal neighbors (low-frequency signals), whereas anomalies tend to have different features from the neighbors (high-frequency signals). Thus networks containing anomalies tend to mix both high-frequency and low-frequency local patterns (Figure 1).
We claim that for GNN-based anomaly detection, the direct adoption of most GNNs might not be optimal, because of the following reasons: 1) The low-pass property of GNNs essentially misaligns with the nature of networks containing anomalies. GNNs potentially smooth the difference between the representations of normal nodes and anomalous nodes by filtering out high frequency signals. As a result, the representation of anomalous nodes learned by GNNs could be indistinguishable and thus inevitably leading to sub-optimal performance for graph anomaly detection problem. 2) Most GNN-based methods apply GNNs with global filtering characteristic (low-/high-/band-pass) for all nodes of the network. However, the anomalous nodes and the normal ones could exploit signals of different frequency bands, respectively. The lack of adaptivity for exploiting information of different frequencies for normal/anomalous nodes, pose a major obstacle in obtaining a more distinguishable representation.
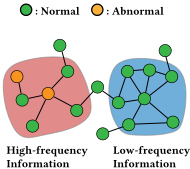
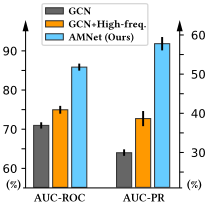
To address the two aforementioned issues on GNN-based graph anomaly detection, one could expect a GNN model beyond a low-pass filter, which could exploit low-frequency information for normal nodes to retain the commonality, and focus on high-frequency information for anomalous ones to emphasize the difference. However, the correlation between information of different frequencies and anomaly detection task is usually very complex and agnostic. Thus we reason that for GNNs to achieve good performance on graph anomaly detection, one has to provide sufficient inductive bias that lets the model adaptively choose either low frequency, high frequency or both for distinguishing anomalous nodes. To achieve this goal, this paper proposes a novel Adaptive Multifrequency filtering graph neural network for graph anomaly detection (AMNet). The core idea is that we fuse both low and high-frequency information adaptively to learn the node embedding for distinguishing the anomalous nodes. More specifically, instead of applying a global low-pass filter, AMNet develops a novel learnable multi-frequency filter group to effectively capture graph signals of both low frequency and high frequency simultaneously. The output signals of the filter group then convey information of multiple frequencies. In addition, we adopt a node-level attention mechanism to empower the model with ability of fusing information of different frequencies for each node substantially.
Our main contributions are summarized as follows:
- To the best of our knowledge, we are the first to identify and integrate the valuable high-frequency information from a spectral perspective in GNN-based anomaly detection. Leveraging signals beyond the low-frequency alleviates the problem that GNNs could produce confused representations as a low-pass filter for graph anomaly detection.
- We propose a novel adaptive multi-frequency GNN framework, AMNet, for graph anomaly detection, which captures information of different frequencies by our designed combinable graph filters. With the favor of the attention mechanism, different information can be adequately fused.
- Our extensive experiments on a series of datasets show that AMNet outperforms the state-of-the-art graph anomaly detection methods by an average improvement of 4.81% in AUC-ROC and 10.2% in AUC-PR.
2 RelatedWork
Graph-based anomaly detection. Graph structured data has been ubiquitous due to its superior capacity to model a wide range of real-world complex systems. Therefore, detecting anomaly in graphs has drawn increased interests in the community. Recently, with the advance that GNNs demonstrate its superior modeling power for graphs, various methods using GNNs have been proposed to solve the attributed network anomaly detection problem. For example, DOMINANT [Ding et al., 2019] computes anomaly ranking scores using a deep GCN-based auto-encoder. GAS [Li et al., 2019] also applies a GCN-based model to spam detection problems. Semi-GNN [Wang et al., 2019] is a semi-supervised GNN model which leverages the hierarchical attention mechanism for fraud detection. Geniepath [Liu et al., 2019] designs an novel aggregate method of GNNs to filter graph signals from neighbors of different hops away for detecting financial fraud. However, none of the aforementioned methods are aware of the limitations caused by adopting GNNs as a low-pass filter for graph anomaly detection. To the best of our knowledge, we are the first to identify the problem from a spectral perspective and attempt to alleviate the problem by our novel approach.
Graph neural networks. Graph neural network (GNN) models have achieved enormous success. Originally inspired by graph spectral theory, [Bruna et al., 2014] first design learnable graph convolution operation in Fourier domain. [Defferrard et al., 2016] further improve the efficiency by leveraging the Chebyshev approximation. The model proposed by [Kipf and Welling, 2017] simplifies the convolution operation by using a linear filter and becomes the most prevailing one. In addition, previous studies have shown that graph neural networks are vulnerable to abnormality [Xu et al., 2022a; Xu et al., 2022b]. Recently, spectral analysis on GNNs has attracted wide interests due to its valuable insight into the interpretablity and expressive power of GNNs. [Balcilar et al., 2021] have attempted to show the majority of GNNs are limited only low-pass filter and argue the necessity of high and/or band-pass filters. However, the aforementioned methods do not take the unique nature of anomaly network mentioned in the introduction into consideration and we are the first to study how to adaptively integrate different signals in anomaly network with mixed frequency pattern.
3 Our Approach
3.1 Preliminaries
Problem definition. We focus on the semi-supervised graph anomaly detection on attributed graphs. Let G = (V,A,X) be an undirected graph, where V is the set of nodes. Each node vi ∈ V has a corresponding feature vector xi ∈ Rd×1 . X = [x1, ..., xn]T ∈ RN×d denotes the feature matrix, and A ∈ RN×N represents the adjacency matrix, where Aij = 1 denotes there is an edge between vi and vj else Aij = 0. Y ∈ RN is an indicator vector representing whether node vi is anomalous or not. Given G and partial node labels, our goal is to learn a estimator to determine whether a given node is anomalous or normal.
Graph spectral filtering. According to theory of graph signal processing [Shuman et al., 2013], one can define the graph filtering operation based on graph Fourier transformation. More specifically, let L be the symmetrically normalized Laplacian, with eigendecomposition L = UΛUT , where Λ = diag[λ1, · · · , λn] is the diagonal matrix of eigenvalues, a signal x ∈ Rn is filtered by a filter g as
Generally, a graph filter g is expressed by some spatiallocalization parametrization methods such as cubic B-spline [Bruna et al., 2014] and Chebyshev polynomial [Defferrard et al., 2016], enjoying the advantanges of localization and linear complexity in the number of edges. Meanwhile, most existing GNNs adopt graph filters with a single frequency band.
3.2 Model Description
To empower GNNs with the capability of identifying abnormalities, we propose a novel framework Adaptive Multifrequency Graph Neural Networks (AMNet). The general idea is to adaptively leverage both low- and high-frequency information.
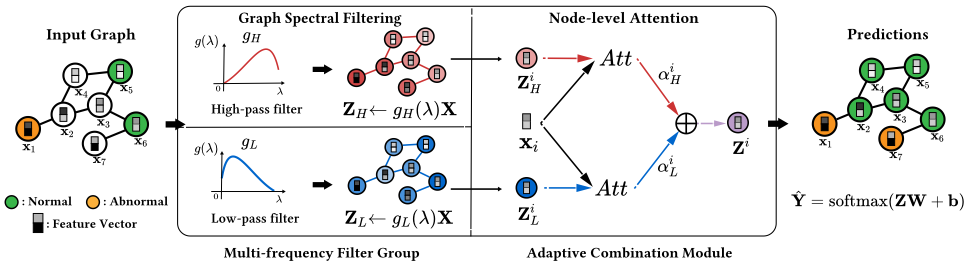
To this end, we first design a group of K graph filters, each of which captures graph signals with different frequencies. Every node in the graph then obtains K signals, whose frequencies are controlled by learnable parameters of graph filters. As we have mentioned before, different nodes favor different frequency signals: normal nodes are more likely to be correlated with low frequency information, while high frequency signals manifest in anomalies who behave differently from the rest. To model the difference among signal preferences, we further propose to use a node-level attention mechanism for fusing the signals adaptively. Finally, the fused embeddings are taken for the classification task. Figure 2 illustrates how AMNet works. We next introduce the details of two major components of our model: multi-frequency filter group and adaptive combination module.
Capturing multiple frequency signals. We design the multi-frequency filter group in order to capture graph signals of different frequencies simultaneously. More specifically, the group consists of multiple trainable graph filters run in parallel, each of which is trained independently in an endto-end manner. Formally, the multi-frequency filter group of K filters is denoted as {gi}i=1,··· ,K . The graph signal Zk filtered by the k-th filter can be generally defined as
The graph filters can be implemented in several different ways. We will give one particular method based on the Bernstein polynomial parametrization in Section 3.3 and provide a theoretical analysis to explain why we choose it. Before that, we introduce how to fuse K signals produced by the multifrequency filter group.
Combing signals adaptively. Through the graph filtering, now we have K specific signals {Zk} with diverse frequency properties. Considering each node can focus on distinct frequency bands, we use the attention mechanism att(Z1, ...,Zk) to learn the corresponding importance (α1, ...,αk) as follows:
where α1, ..., αk ∈ Rn×1 are the attention values of n nodes with Z1, ...,Zk, respectively. More specifically, considering the node vi with filtered signals zik ∈ R1×h (i.e., the i-th row of Zk), we have its attention scores as
whereWZ ∈ Rh′ ×h andWX ∈ Rh′ ×d indicate the weight matrices and q ∈ Rh′ ×1 is the shared attention vector. The final attention weights of node vi are obtained by normalizing the attention values ωik with softmax function as
Larger αik implies that the node vi favors the k-th filter's frequency band. Defining αk = diag ([αik ]), we have the final embedding Z by combining the filtered signals:
From another aspect, we find that AMNet actually applies a personalized graph filter ˆ gi for each node vi. In particular, the final embedding zi of vi can be equivalently expressed as
where ˆ gi = ∑k αik gk is the linear combination of filter group with attention weights. Thus AMNet provides the adaptivity for each node to learn its own graph filter.
3.3 The Choice of Graph Filter
Combinable graph filter parametrization. In this section we discuss the implementation of graph filters in the multifrequency filter group of AMNet. From Equation 7, we see that AMNet adaptively learns a filter for each node by combining the filters in the multi-frequency filter group. However, designing a graph filter suitable for combining is non-trivial because most existing graph filters, such as cubic B-spline or Chebyshev polynomial, face following two challenges: 1) Most existing graph filters may derive negative spectral functions, which leads to complex combination result according to graph signal processing theory. 2) The frequency characteristic of a filter is scale-invariant. It means that the filters
AMNet
with larger scale will be dominant over the ones with smaller scale, which diminishes the adaptivity to learning filter focusing on different frequencies.
To address aforementioned issues, we introduce the restricted Bernstein polynomial parametrization to approximate filters in our multi-frequency group.
Definition 3.1 (Restricted Bernstein polynomial parametrization). Define the graph filter to be parametrized by Berstein polynomials with coefficients θm that are restricted in the interval [0, 1]:
Here bm(λ) = (Mm)λm(1 - λ)M-m is the m-th Bernstein basis of order M, and θ ∈ [0, 1]M is a learnable vector of polynomial coefficients. Note that bMm (λ) ≥ 0 for λ ∈ [0, 1], thus avoiding phase shift. Besides, due to ∑ bMm (λ) = 1 and coefficients θ are restricted in [0, 1], h(λ) ranges in [0, 1]. Then all filters of the filter group share uniform scales. Therefore our method avoid the aforementioned limitations for being combined, while enjoying the same advantages of existing methods such as spatial localization and linear learning complexity. Note that [He et al., 2021] also attempts to show the advantages of Bernstein polynominal parametrization on general graph filter modeling, while this paper focuses on developing unified and combinable graph filters.
Expressive power analysis. We next provide a theoretical analysis to demonstrate that our parametrization enables the filter group to capture multiple frequency graph signals.
Theorem 1. The restricted Bernstein polynomial parametrization can equivalently express arbitrary graph filter with continuous frequency response function.
Proof. Let us define U to be the set of restricted Bernstein polynomial that are all in [0, 1]. We further define V to be the set of polynomials which map the interval [0, 1] into (0, 1). According to [Qian et al., 2011], we have V ⊂ U. Because the frequency profile of a filter is only determined by the relative absolute value of amplitude, arbitrary frequency response function can be transformed into an equivalent one that map [0, 1] to (0, 1). According to the Weierstrass Approximation Theorem [Jeffreys and Jeffreys, 1999], let f be a continuous function that map [0, 1] to (0, 1), for any ϵ > 0, there exists a polynomial function p ∈ V such that for all x in [0, 1], we have |f(x) - p(x)| < ϵ.
Thus, our restricted Bernstein polynomial parametrization could express filters with diverse frequency properties, e.g., low/band/high-pass filters.
3.4 Objective Function
Here we describe the general training objective of AMNet.
Margin-based constraint on attention. Intuitively, to enhance the difference, anomalous nodes need to exploit more high-frequency information. Here we apply a constraint on attention training to capture the intuition which encourages that anomalous nodes and normal nodes focus on different filters, respectively. For example, assuming two filters {gL, gH} namely with attention value {αL, αH}, the marginbased constraint on attention La can be defined as
where ζ is slack variable which controls the margin between attention values, and ri = 1 when Yi = 1, else ri = -1.
Optimization objective. We use the output embedding Z in Eq. (6) for semi-supervised classification. Suppose the ˆY ∈ RN×2 denotes the probability of nodes belonging to the anomalous and the normal. Then ˆY can be calculated with a linear transformation and a softmax function:
Then we have the overall objective function by combining the classification task and constraint on attention:
where Lc represents the loss derived from node classification (e.g, cross entropy) and β ≥ 0 is the parameter that weights the constraint itemLa.
4 Experiments
In this section, we perform evaluations on the effectiveness of (AMNet) under four real-world datasets. More specifically, we aim to answer the following research questions:
- RQ1: How does AMNet perform against state-of-the-art baselines on real-world graph anomaly detection tasks?
- RQ2: Can AMNet effectively capture both low-frequency and high-frequency information, and fuse both adpatively?
- RQ3: Do the components of the AMNet framework work as designed? And how do different modules contribute to the performance of AMNet.
4.1 Experimental Setup
We adopt four real-world datasets that have been used in the previous research to evaluate AMNet. Characteristics of these datasets are summarized in Table 2.
- Yelp [Rayana and Akoglu, 2015]: It contains reviews for restaurants in several states of the U.S.. The links are created between two reviews if they are posted by the same user. Our goal is to detect fake reviews here.
- Elliptic [Weber et al., 2019]: It is a bitcoin transaction network, where nodes are transactions and edges are the flows of Bitcoin currency. We train and apply our model to predict illicit transcations.
- FinV [Yang et al., 2019]: It is a social network provided by FinVolution group, one of the leading fintech platforms in China. Based on the social relationships between users, we aim to predict financial frauds.
- Telecom [Yang et al., 2021]: It is a mobile communication network anonymized and provided by China Telecom, the major mobile service providers in China. Our task is to predict telemarketing frauds.
Comparison methods. We compare AMNet with two categories of baselines: 1) general GNNs model, including GCN [Kipf and Welling, 2017], GraphSAGE [Hamilton et al., 2017], GAT [Veliˇckovi´c et al., 2018] and GIN [Xu et al., 2018]. 2) GNN-based anomaly detection model, including DOMINANT [Ding et al., 2019], GeniePath [Liu et al., 2019], GraphConsis [Liu et al., 2020] and CARE-GNN [Dou et al., 2020], which are introduced in Sec 2. Some other relevant GNN-based models like GAS [Li et al., 2019] and SemiGNN [Wang et al., 2019] are not included in our experiment considering their less effectiveness and efficiency.
Evaluation metrics. We adopt two widely-used and complementary metrics: the Area Under Receiver Operating Characteristic (AUC-ROC) and AUC-PR [Dou et al., 2020; Ding et al., 2021]. The latter pays more attention to the ranking of anomalies than that of normal samples.
Implementation details. All baseline methods are initialized with the same parameters suggested by their official codes and have been carefully fine-tuned. In addition, for baselines that are able to handle heterogeneous graphs, we leverage the possible multi-relation information of the input graph. The filter number K of AMNet is set to 2. For all methods, we report the average results of 10 independent runs.
4.2 Effectiveness Results (RQ1)
Table 1 presents the experimental results. Overall, we see that the proposed AMNet outperforms all other baselines in all the datasets. More specifically, it achieves an improvement of 4.81% on AUC-ROC, and 10.2% on AUC-PR. Among all the baselines, DOMINANT, as the state-of-the-art unsupervised gnn-based method, performs the worst due to the lack of supervision. The highlighted results in the table are from AMNet, which is able to exploit both low and high-frequency information, keeping advantage over all the general GNNs and GNN-based graph anomaly detection comparison methods consistently.
4.3 Graph Filters and Adaptive Capability (RQ2)
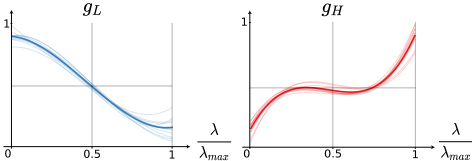
Visualization of graph filters. To gain a deeper insight into our model, we plot the filter group in Figure 3. It illustrates two filters gL and gH learned from real-world dataset Elliptic. We see that gL exhibits low-pass property while gH exhibits high-pass property. This phenomena is consistent with the key idea that both low frequency and high frequency information contribute to anomaly detection. It further suggests that AMNet can learn filters that capture multiple frequency signals in an end-to-end manner.
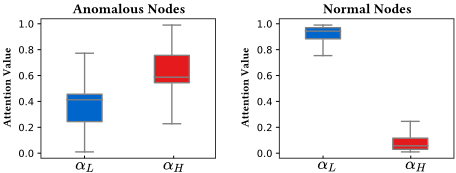
Analysis of attention distribution. We conduct the attention distribution analysis on public real-world dataset Elliptic in Figure 4. We see that normal nodes tend to have dominant attention value on low-pass filter gL, and therefore preserve stronger low-frequency signals, whereas anomalous nodes emphasize high-frequency signals. This difference effectively sharpens the contrast between normal nodes and anomalous nodes, thus making it easier for the anomaly to be captured by the model. In summary, the experiment demonstrates that our proposed AMNet is able to adaptively adopt graph signals with suitable frequencies for different nodes.
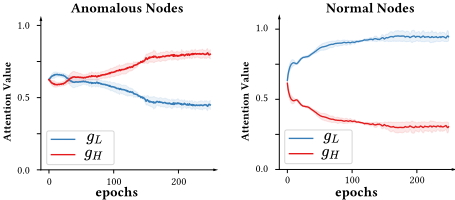
Analysis of attention trend. We next further analyze the changing trends of attention values during the training process in Figure 5, where x-axis is the epoch and y-axis is the average attention value of nodes. We can see that the attention value for high-pass filter gH of anomalous nodes gradually increases, while the attention value for low-pass filter gL keeps decreasing. Meanwhile, the attention value of normal nodes goes in the opposite way. This trend is consistent with the observation in Figure 4, and suggests that AMNet can learn the contribution of different frequency components gradually.
| Methods | Dataset | Yelp | Elliptic | FinV | TeleCom | ||||
|---|---|---|---|---|---|---|---|---|---|
| AUC-ROC | AUC-PR | AUC-ROC | AUC-PR | AUC-ROC | AUC-PR | AUC-ROC | AUC-PR | ||
| Graph Neural Networks | |||||||||
| GCN | 70.97 ± 0.8 | 29.93 ± 0.6 | 84.57 ± 0.4 | 33.17 ± 0.3 | 64.64 ± 1.1 | 9.04 ± 0.3 | 76.69 ± 1.2 | 59.85 ± 1.2 | |
| GAT | 74.68 ± 1.3 | 35.44 ± 1.1 | 86.03 ± 1.5 | 56.81 ± 0.9 | 65.97 ± 1.5 | 9.44 ± 0.2 | 79.15 ± 1.8 | 64.43 ± 0.5 | |
| GraphSAGE | 73.65 ± 0.8 | 36.11 ±0.7 | 85.28 ± 2.1 | 55.29 ± 1.3 | 72.13 ± 1.9 | 16.54 ± 0.9 | 76.02 ± 1.2 | 64.07 ± 0.7 | |
| GIN | 68.50 ± 1.3 | 31.22 ± 1.3 | 85.11 ± 1.3 | 37.34 ± 1.3 | 67.44 ± 1.3 | 20.02 ± 1.3 | 76.51 ± 1.3 | 59.48 ± 1.3 | |
| GNN-based Graph Anomaly Detection Models | |||||||||
| DOMINANT | 49.32 ± 0.8 | 15.58 ± 0.3 | 16.21 ± 0.3 | 5.48 ± 0.1 | 64.59 ± 1.1 | 8.28 ± 0.3 | 55.43 ± 0.7 | 15.68 ± 0.3 | |
| GeniePath | 75.89 ± 1.8 | 35.86 ± 0.5 | 83.14 ± 1.3 | 44.37 ± 0.8 | 72.27 ± 1.2 | 18.43 ± 0.7 | 83.73 ± 0.7 | 64.25 ± 0.3 | |
| GraphConsis | 70.40 ± 1.3 | 27.02 ± 0.8 | 86.14 ± 1.1 | 62.04 ± 1.2 | 72.82 ± 1.2 | 27.07 ± 1.0 | 77.91 ± 1.5 | 61.82 ± 0.5 | |
| CARE-GNN | 78.41 ± 1.5 | 38.90 ± 1.1 | 85.84 ± 1.2 | 49.81 ± 1.2 | 70.31 ± 1.8 | 23.61 ± 0.3 | 81.02 ± 0.7 | 68.06 ± 1.6 | |
| AMNet | 85.85 ± 1.1 | 57.77 ± 0.9 | 88.52 ± 1.0 | 74.62 ± 1.4 | 78.38 ± 1.8 | 29.31 ± 0.8 | 87.62 ± 1.3 | 75.18 ± 0.9 | |
| Dataset | Yelp | Elliptic | FinV | Telecom |
|---|---|---|---|---|
| # nodes | 45,954 | 46,564 | 11,053 | 340,751 |
| # edges | 3,846,979 | 73,248 | 25,944 | 3,150,996 |
| # features | 32 | 93 | 8 | 261 |
| Abnormal(%) | 14.53 | 9.76 | 4.46 | 4.62 |
4.4 Ablation Analysis (RQ3)
In this section, we compare AMNet with its two variants on Elliptic and Yelp to validate the effectiveness of the designed modules.
- AMNet-Cheb: it replaces the Bernstein polynomial by the Chebyshev polynomial for graph filters in AMNet.
- AMNet-AC: it removes the margin-based constraint on attention La in AMNet.
From the results in Table 3, we see that AMNet notably outperforms AMNet-Cheb by an average improvement of
14% on AUC-PR, which is consistent with the analysis in Sec 3.3 on the advantages of our filter over general graph filters for combining different graph signals. And we also find that introducing the attention constraint improves the performance by guiding the anomalous nodes and normal nodes paying more attention on signals of different frequencies, respectively.
| Dataset | Elliptic | Yelp | ||
|---|---|---|---|---|
| AUC-ROC | AUC-PR | AUC-ROC | AUC-PR | |
| AMNet-Cheb | 86.11 | 60.44 | 81.70 | 44.80 |
| AMNet-AC | 87.92 | 72.27 | 85.03 | 56.78 |
| AMNet | 88.52 | 74.62 | 85.85 | 57.77 |
5 Conclusion
In this paper, we study the problem of can abnormality be detected by graph neural networks. We answer this issue by exploring the nature of GNNs, and analyzing the characteristics of graph signals in anomaly detection scenarios. We conclude that most existing GNNs only consider graph signals with single frequency, whereas abnormality and normal nodes favors different frequency bands. Therefore, to further enhance GNNs' performance in anomaly detection, we proposed AMNet, a novel Adaptive Multi-frequency Graph Neural Network, aiming to adaptively combine multiple frequency signals for each node. Experimental results demonstrate that our model achieves a significant improvement comparing with several state-of-the-art baseline methods.
Acknowledgements
This work was partially supported by NSFC (62176233), the National Key Research and Development Project of China (2018AAA0101900), and the Fundamental Research Funds for the Central Universities.
@inproceedings{ijcai2022p270,
  title     = {Can Abnormality be Detected by Graph Neural Networks?},
  author    = {Chai, Ziwei and You, Siqi and Yang, Yang and Pu, Shiliang and Xu, Jiarong and Cai, Haoyang and Jiang, Weihao},
  booktitle = {Proceedings of the Thirty-First International Joint Conference on
               Artificial Intelligence, {IJCAI-22}},
  publisher = {International Joint Conferences on Artificial Intelligence Organization},
  editor    = {Luc De Raedt},
  pages     = {1945--1951},
  year      = {2022},
  month     = {7},
  note      = {Main Track},
  doi       = {10.24963/ijcai.2022/270},
  url       = {https://doi.org/10.24963/ijcai.2022/270},
}
TY - CPAPER TI - Can Abnormality be Detected by Graph Neural Networks? AU - Chai, Ziwei AU - You, Siqi AU - Yang, Yang AU - Pu, Shiliang AU - Xu, Jiarong AU - Cai, Haoyang AU - Jiang, Weihao T2 - Proceedings of the Thirty-First International Joint Conference on Artificial Intelligence, IJCAI-22 PB - International Joint Conferences on Artificial Intelligence Organization PY - 2022 SP - 1945 EP - 1951 DO - 10.24963/ijcai.2022/270 UR - https://doi.org/10.24963/ijcai.2022/270 ER -Copied
Machine-readable versions of this paper, for tools and AI agents:





