
Interpret ESG Rating’s Impact on the Industrial Chain Using Graph Neural Networks
Proceedings of the Thirty-Second International Joint Conference on Artificial Intelligence. AI for Good. Pages 6076-6084.
https://doi.org/10.24963/ijcai.2023/674
Keywords
- AI for Good: Machine Learning
- AI for Good: Multidisciplinary Topics and Applications
Abstract
We conduct a quantitative analysis of the development of the industry chain from the environmental, social, and governance (ESG) perspective, which is an overall measure of sustainability. Factors that may impact the performance of the industrial chain have been studied in the literature, such as government regulation, monetary policy, etc. Our interest lies in how the sustainability change (i.e., ESG shock) affects the performance of the industrial chain. To achieve this goal, we model the industrial chain with a graph neural network (GNN) and conduct node regression on two financial performance metrics, namely, the aggregated profitability ratios and operating margin. To quantify the effects of ESG, we propose to compute the interaction between ESG shocks and industrial chain features with a cross-attention module, and then filter the original node features in the graph regression. Experiments on two real datasets demonstrate that (i) there are significant effects of ESG shocks on the industrial chain, and (ii) model parameters including regression coefficients and the attention map can explain how ESG shocks affect the performance of the industrial chain.
- [Amiraslani et al., 2017] Hami Amiraslani, Karl V Lins, Henri Servaes, and Ane Tamayo. A matter of trust? the bond market benefits of corporate social capital during the financial crisis. CEPR Discussion Paper No. DP12321, 2017.
- [An et al., 2014] Haizhong An, Weiqiong Zhong, Yurong Chen, Huajiao Li, and Xiangyun Gao. Features and evolution of international crude oil trade relationships: A trading-based network analysis. Energy, 74:254-259, 2014.
- [Barrot and Sauvagnat, 2016] Jean-Noel Barrot and Julien Sauvagnat. Input specificity and the propagation of id- iosyncratic shocks in production networks. Quarterly Journal of Economics, 131(3):1543-1592, 2016.
- [Capelle-Blancard and Petit, 2019] Gunther Capelle- Blancard and Aurélien Petit. Every little helps? esg news and stock market reaction. Journal of Business Ethics, 157:543-565, 2019.
- [Carvalho and Tahbaz-Salehi, 2019] Vasco M. Carvalho and Alireza Tahbaz-Salehi. Production networks: A primer. Annual Review of Economics, 11(1):635-663, 2019.
- [Chang et al., 2019] Ching-Hung Chang, Sheng-Syan Chen, Yan-Shing Chen, and Shu-Cing Peng. Commitment to build trust by socially responsible firms: Evidence from cash holdings. Journal of Corporate Finance, 56:364-387, 2019.
- [Cheng et al., 2014] Beiting Cheng, Ioannis Ioannou, and George Serafeim. Corporate social responsibility and ac- cess to finance. Strategic management journal, 35(1):1- 23, 2014.
- [Consolandi et al., 2020] Costanza Consolandi, Himani Phadke, Jim Hawley, and Robert G Eccles. Material esg outcomes and sdg externalities: Evaluating the health care sector's contribution to the sdgs. Organization & Environment, 33(4):511-533, 2020.
- [Defferrard et al., 2016] Michaël Defferrard, Xavier Bres- son, and Pierre Vandergheynst. Convolutional neural networks on graphs with fast localized spectral filtering. In Proceedings of the 30th International Conference on Neural Information Processing Systems, NIPS'16, page 3844-3852, Red Hook, NY, USA, 2016.
- [Derrien et al., 2021a] Franc ¸ois Derrien, Philipp Krueger, Augustin Landier, and Tianhao Yao. ESG News, Future Cash Flows, and Firm Value. Technical Report HAL- 03857579, HAL, August 2021.
- [Derrien et al., 2021b] Franc ¸ois Derrien, Philipp Krueger, Augustin Landier, and Tianhao Yao. How do esg incidents affect firm value? SSRN Working Paper 3903274, 2021.
- [Di Giuli and Kostovetsky, 2014] Alberta Di Giuli and Leonard Kostovetsky. Are red or blue companies more likely to go green? politics and corporate social responsi- bility. Journal of Financial Economics, 111(1):158-180, 2014.
- [Duvenaud et al., 2015] David Duvenaud, Dougal Maclau- rin, Jorge Aguilera-Iparraguirre, Rafael Gómez- Bombarelli, Timothy Hirzel, Alán Aspuru-Guzik, and Ryan P. Adams. Convolutional networks on graphs for learning molecular fingerprints. In Proceedings of the 28th International Conference on Neural Information Pro- cessing Systems -Volume 2, NIPS'15, page 2224-2232, Cambridge, MA, USA, 2015. MIT Press.
- [Geng et al., 2014] Jiang-Bo Geng, Qiang Ji, and Ying Fan. A dynamic analysis on global natural gas trade network. Applied Energy, 132:23-33, 2014.
- [Gheini et al., 2021] Mozhdeh Gheini, Xiang Ren, and Jonathan May. Cross-attention is all you need: Adapting pretrained Transformers for machine translation. In Pro- ceedings of the 2021 Conference on Empirical Methods in Natural Language Processing, pages 1754-1765, Novem- ber 2021.
- [Giese et al., 2019a] Guido Giese, Linda-Eling Lee, Dimitris Melas, Zoltán Imre Nagy, and Laura Nishikawa. Founda- tions of esg investing: How esg affects equity valuation, risk, and performance. In The Journal of Portfolio Man- agement, volume 45 (5), page 69-83, 2019.
- [Giese et al., 2019b] Guido Giese, Linda-Eling Lee, Dim- itris Melas, Zoltn Nagy, and Laura Nishikawa. Founda- tions of esg investing: How esg affects equity valuation, risk, and performance. The Journal of Portfolio Manage- ment, 45(5):69-83, 2019.
- [Gillan et al., 2021] Stuart L Gillan, Andrew Koch, and Laura T Starks. Firms and social responsibility: A review of esg and csr research in corporate finance. Journal of Corporate Finance, 66:101889, 2021.
- [Gilmer et al., 2017] Justin Gilmer, Samuel S. Schoenholz, Patrick F. Riley, Oriol Vinyals, and George E. Dahl. Neural message passing for quantum chemistry. In Proceedings of the 34th International Conference on Machine Learning, ICML'17, page 1263-1272. JMLR.org, 2017.
- [Gregory et al., 2014] Alan P. R. Gregory, Rajesh Tharyan, and Julie M. Whittaker. Corporate social responsibility and firm value: Disaggregating the effects on cash flow, risk and growth. Journal of Business Ethics, 124:633-657, 2014.
- [Hamilton et al., 2017] William L. Hamilton, Rex Ying, and Jure Leskovec. Inductive representation learning on large graphs. In Proceedings of the 31st International Confer- ence on Neural Information Processing Systems, NIPS'17, page 1025-1035, Red Hook, NY, USA, 2017.
- [Hao et al., 2016] Xiaoqing Hao, Haizhong An, Hai Qi, and Xiangyun Gao. Evolution of the exergy flow network em- bodied in the global fossil energy trade: Based on complex network. Applied Energy, 162:1515-1522, 2016.
- [Jaegle et al., 2022] Andrew Jaegle, Sebastian Borgeaud, Jean-Baptiste Alayrac, Carl Doersch, Catalin Ionescu, David Ding, Skanda Koppula, Daniel Zoran, Andrew Brock, Evan Shelhamer, Olivier J Henaff, Matthew Botvinick, Andrew Zisserman, Oriol Vinyals, and Joao Carreira. Perceiver IO: A general architecture for struc- tured inputs & outputs. In International Conference on Learning Representations, 2022.
- [Kipf and Welling, 2017] Thomas N. Kipf and Max Welling. Semi-supervised classification with graph convolutional networks. In Proceedings of the Fifth International Con- ference on Learning Representations, ICLR 2017, 2017.
- [Leontief, 1951] Wassily W Leontief. The structure of amer- ican economy, 1919-1939: An empirical application of equilibrium analysis. The Journal of Economic History, 1951.
- [Li et al., 2022a] Hao Li, Xuan Zhang, and Yang Zhao. Esg and firm's default risk. Finance Research Letters, 47:102713, 2022.
- [Li et al., 2022b] Xiaotong Li, Hua Zhang, Xuanru Zhou, and Weiqiong Zhong. Research on the evolution of the global import and export competition network of chromium resources from the perspective of the whole in- dustrial chain. Resources Policy, 79:102987, 2022.
- [Radford et al., 2021] Alec Radford, Jong Wook Kim, Chris Hallacy, Aditya Ramesh, Gabriel Goh, Sandhini Agar- wal, Girish Sastry, Amanda Askell, Pamela Mishkin, Jack Clark, Gretchen Krueger, and Ilya Sutskever. Learning transferable visual models from natural language supervi- sion. In International Conference on Machine Learning, pages 139:8748-8763, 2021.
- [Serafeim and Yoon, 2021] George Serafeim and Aaron S. Yoon. Stock price reactions to esg news: The role of esg ratings and disagreement. Review of Accounting Stud- ies, pages https://doi.org/10.1007/s11142-022-09675-3, 2021. DOI
- [Serafeim et al., 2022] Georgios Serafeim, George Ser- afeim, and Aaron Yoon. Which corporate esg news does the market react to? Financial Analysts Journal, 78(1):59- 78, 2022.
- [Tan et al., 2022] Zhuo Tan, Bin Liu, and Guosheng Yin. Asymmetric self-supervised graph neural networks. In 2022 IEEE International Conference on Big Data (Big Data), pages 1369-1376, 2022.
- [Vaswani et al., 2017] Ashish Vaswani, Noam Shazeer, Niki Parmar, Jakob Uszkoreit, Llion Jones, Aidan N. Gomez, Łukasz Kaiser, and Illia Polosukhin. Attention is all you need. In Proceedings of the 31st International Conference on Neural Information Processing Systems, NIPS'17, page 6000-6010, 2017.
- [Veličković et al., 2018] Petar Veličković, Guillem Cucurull, Arantxa Casanova, Adriana Romero, Pietro Liò, and Yoshua Bengio. Graph attention networks. In Interna- tional Conference on Learning Representations, 2018.
- [Wang et al., 2019] Hao Wang, Tong Xu, Qi Liu, Defu Lian, Enhong Chen, Dongfang Du, Han Wu, and Wen Su. Mcne: An end-to-end framework for learning multiple condi- tional network representations of social network. KDD '19, page 1064-1072, New York, NY, USA, 2019. Associ- ation for Computing Machinery.
- [Wu et al., 2022] Shiyu Wu, Xinyi Li, Xiaosen Du, and Zexin Li. The impact of esg performance on firm value: The moderating role of ownership structure. Sustainabil- ity, 14(21), 2022.
- [Yang et al., 2022] Zhen Yang, Ming Ding, Bin Xu, Hongxia Yang, and Jie Tang. Stam: A spatiotemporal aggregation method for graph neural network-based recommendation. In Proceedings of the ACM Web Conference 2022, WWW '22, page 3217-3228, New York, NY, USA, 2022. Associ- ation for Computing Machinery.
- [Yao et al., 2019] Liang Yao, Chengsheng Mao, and Yuan Luo. Graph convolutional networks for text classification. In Proceedings of the Thirty-Third AAAI Conference on Artificial Intelligence and Thirty-First Innovative Applica- tions of Artificial Intelligence Conference and Ninth AAAI Symposium on Educational Advances in Artificial Intelli- gence, AAAI'19/IAAI'19/EAAI'19. AAAI Press, 2019.
- [Zeidan and Spitzeck, 2015] Rodrigo Zeidan and Heiko Spitzeck. The sustainability delta: Considering sustain- ability opportunities in firm valuation. Sustainable Devel- opment, 23(6):329-342, 2015.
- [Zhu et al., 2022] Junwei Zhu, Yingjia Zhai, Shilan Feng, Ya Tan, and Wendong Wei. Trade-offs and synergies among air-pollution-related sdgs as well as interactions be- tween air-pollution-related sdgs and other sdgs. Journal of Cleaner Production, 331:129890, 2022.
References were extracted automatically from the PDF and may contain errors.
Full text extracted automatically from the PDF; figures, tables and equations may differ. The PDF is the version of record.
1 Introduction
Recently, the digital development of the industrial chain attracts more and more attentions from researchers and policymakers [An et al., 2014; Hao et al., 2016; Geng et al., 2014; Li et al., 2022b]. One of the critical issues is how the efficiency of the industrial chain is affected by external factors, such as the macroeconomic policy, government regulation or monetary policy, international political factors, as well as internal factors, such as microeconomic driver factors, and so on.
In contrast to these traditional factors, sustainability and ethical issues are particularly worthy of investigation [Serafeim and Yoon, 2021], which are potential new drivers of development of the industrial chain. Unfortunately, there is limited research on how sustainability and ethical consideration affect the aggregate performance of the industrial chain in the literature. Our work focuses on studying how the environmental, social, and governance (ESG), a performance evaluation of the sustainability and ethical impacts, affects the development of the industrial chain.
∗Corresponding author
The ESG issues in business have been a fast-growing phenomenon. The number of companies reporting their ESG data publicly has been increasing dramatically since the early 1990s all over the world [Serafeim et al., 2022]. Among all the ESG related data, the ESG rating released by a trusted third-party institution is one of the most important metrics for the ESG evaluation. The ESG rating has been demonstrated to affect the cash-flow, risk, and valuation of a firm [Giese et al., 2019b; Zeidan and Spitzeck, 2015; Derrien et al., 2021a].
We are interested in how ESG affects the aggregate performance of the industrial chain. The rationale is that these ESG-linked variations in cash-flow, risk, and valuation will cause a series of reactions on the production cost to the corresponding industry nodes. Suppose that industry i is hit by a negative ESG shock on cash-flow, and it may reduce its production and hence increase the price of good i. Such a price increase adversely impacts all downstream industries linked to good i [Carvalho and Tahbaz-Salehi, 2019]. Because they rely on good i as an intermediate input for their production, it causes a direct shock on the downstream industries' customer companies. Consequently, the shock will be propagated over the whole industrial chain.
Traditionally, researchers investigate the efficiency of the industrial chain with Leontief's input-output production theory [Leontief, 1951; Carvalho and Tahbaz-Salehi, 2019]. However, the input-output production method fails to consider external shocks. Our goal is to study the ESG shocks on the industrial chain from the perspective of deep graph representation learning. In the past few years, graph neural networks (GNNs) have played a central role in modeling network data and achieved state-of-the-art performance in a wide range of applications, such as social network analysis [Wang et al., 2019; Tan et al., 2022], recommendation systems [Yang et al., 2022], text [Yao et al., 2019], molecule recognition [Duvenaud et al., 2015], quantum chemistry [Gilmer et al., 2017], and so on. The propagation of ESG shocks over the industrial network can be viewed as a neural message-passing problem under the framework of GNNs. To the best of our knowledge, this is the first work of studying ESG shocks on the industrial chain using GNNs.
We first collect financial data from the firms that belong to an industrial node as its node features. Additionally, the supplier-customer linkages among industrial nodes are available, which can be quantified as an adjacency matrix. The adjacency matrix and node features can be taken as an initial setting of our model. We further incorporate ESG shocks into our model with a cross-attention mechanism. To achieve that goal, we first define an industrial ESG based on its subordinate firms' ESG scores using the bag-of-words model. We then calculate a query of cross-attention with a regression model under which the explanatory variables are industrial ESG scores and the changes of those scores. Finally, we integrate the ESG shocks into a graph convolutional network (GCN) by filtering the original industrial node features with the cross-attention map from ESG. We conduct extensive experiments on China's industrial data provided by ChinaScope iNews 1 from 2018 to 2020 and the ESG data released by Sino-Securities Index Information Service.
The contributions of this work can be summarized as follows:
- First, we define an industrial ESG based on the affiliated firms' ESG scores using the bag-of-words model;
- Second, we propose to integrate the cross-attention mechanism into GNNs to interpret the ESG shocks propagation over the industrial chain;
- Finally, we substantiate the proposed model with analysis of the real-world industrial chain and ESG rating data.
2 RelatedWorks
2.1 Industrial Chain
First of all, our paper is related to the studies on modeling the industrial chain with classical econometric methods, such as the spatial regression model [Gillan et al., 2021] and inputoutput model [Leontief, 1951; Barrot and Sauvagnat, 2016]. These methods model the production process of humans with the tool of linear algebra. Under the framework of matrix theory, the production process can be interpreted conveniently. However, the input-output model only accepts the adjacent relationship among industrial nodes as the input, making it difficult to be extended to predicting additional node features.
Another stream of studies on modeling the industrial chain pertains to complex networks. For example, [2016] use complex network techniques to study the evolution of the fossil energy industrial chain; [2014] and [2014] focus on analyzing the trade-based network of international crude oil and natural gas from the view of the petroleum industrial chain and natural gas industrial chain, respectively. Likewise, [2022b] examine the chromium resources competition network from the perspective of the whole chromium industrial chain.
1 https://inews.chinascope.com.cn/#/index
2.2 ESG
The ESG factors are environmental, social, and governance matters that have great impacts on the economy. The ESG ratings are usually given by authoritative rating agencies [Cheng et al., 2014]. The ESG shocks are defined as the changes in the ESG ratings (e.g., upgrade or downgrade). The ESG shocks may have a positive or negative impact on the financial performance of a firm. For example, ESG shocks may exert a positive/negative impact on the price [Serafeim and Yoon, 2021], as well as on future returns [Serafeim and Yoon, 2021]. In addition, ESG shocks may influence the return on assets (ROA) [Di Giuli and Kostovetsky, 2014], cash value [Chang et al., 2019], bond value [Amiraslani et al., 2017] and revenue growth [Di Giuli and Kostovetsky, 2014]. All the existing works of ESG shocks focus on the firm-level analysis from the microeconomic perspective. In contrast, our goal is to study the ESG shocks on the whole industrial chain from the macroeconomic view. A concept similar to ESG is known as the Sustainable Development Goals (SDGs), proposed by the United Nations. Many institutional investors use SDGs to allocate resources or highlight related investments [Consolandi et al., 2020; Zhu et al., 2022]. Clearly, SDGs and ESG have overlapping missions.
2.3 Cross Attention
Recently, the attention mechanism, such as self- and crossattention, has gained popularity and attracted more research [Vaswani et al., 2017]. The self-attention mechanism computes the symmetrical interaction among a single feature sequence. The cross-attention makes an asymmetrical fusion of multiple separate sequences of the same dimension and calculates the interaction between them. These sequences may come from multimodal inputs, such as image, text, and audio [Radford et al., 2021; Jaegle et al., 2022]. In multimodel settings, cross-attention usually plays a more important role than self-attention in the sense that it can result in more degradation in performance through pruning. For instance, [2021] reveal that fine-tuning only the cross-attention parameters can be nearly as effective as fine-tuning all parameters.
3 Background and Data Description
3.1 TheWhole Industry Chain
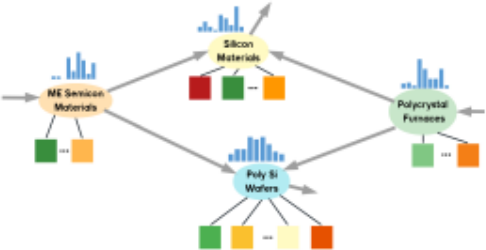
The industrial chain (or industry network) is an industry-level production network [Carvalho and Tahbaz-Salehi, 2019]. It can be represented by a directed graph that reflects the upstream and downstream supply relationships. As shown in Figure 1, each node in this graph-which we refer to as the industry chain-corresponds to an industry. A direct edge from node i to node j suggests industry i is an input-supplier of industry j. Each node of the industrial chain usually contains a collection of firms which are the carriers of the industrial chain nodes. For example, Figure 1 shows visualization of the semiconductor industry chain. It illustrates four industry nodes: Silicon Materials, Polysilicon Silicon Wafers (Poly Si Wafers), Manufacturing Equipment for Semiconductor Materials (ME Semicon Materials), and Polycrystal Furnaces. ME Semicon Materials and Polycrystal Furnaces are the upstreams of Silicon Materials and Poly Si Wafers, which supply the necessary equipments for the production of the downstreams. Each industry node contains a collection of enterprises, and usually there are no intersections among the enterprises affiliated with different industry nodes.
3.2 The ESG Score
What is ESG?
The environmental, social, and governance (ESG) is an objective measurement or evaluation of a given company, fund, or security's performance with respect to ESG issues. Because ESG issues grow in prominence in almost every sector, the ability to manage ESG risks and opportunities is increasingly important that may affect corporations' financial performances. Consequently, both companies and investors are putting more and more emphasis on ESG. On the one hand, companies try to be highly compliant with ESG principles to alleviate conflicts with stakeholders, in order to minimize the probability of failure and the likelihood of default [Wu et al., 2022]. On the other hand, investors who follow the ESG ranking can be more effective in avoiding "sinful companies" (such as alcohol, tobacco and gambling companies) that may pose greater financial risks due to their environment, society and community practices [Wu et al., 2022].
Firm-level ESG Rating
There is a growing need for evaluating a firm's ESG level, for which the ESG rating is often adopted. Recently, the number of global ESG rating agencies has exceeded 600. Their goal is to generate a number, typically a discrete grade to quantify an individual company's overall ESG performance. For example, a nine-grade score {AAA,AA,A,BBB,BB,B,CCC,CC,C} is used in our dataset. Each rating takes into account a large amount of information across various categories. In comparison with their peers, ESG leaders proactively manage ESG risk and take advantage of ESG opportunities more effectively, and ESG laggards have relatively more unmanageable exposure to ESG risks.
ESG Shocks
The impact of firm-level ESG scores and news on financial performance has been well studied in the literature [Giese et al., 2019a; Derrien et al., 2021b; Capelle-Blancard and Petit, 2019]. Companies with strong ESG profiles are more competitive, because they are typically better at developing long-term business and incentive plans for senior management [Gregory et al., 2014].
The ESG shock is defined as the change in a firm's ESG rating. Usually, the sustainability change is likely to affect a firm's revenue directly. For example, a severe downgrade in the ESG rating (i.e., a negative shock) of a firm may lead to a boycott from the potential clients. In contrast, an improvement in the ESG score (i.e., a positive shock) of a firm may incite new customers to buy its products. From a global view, we aim to analyze the impact of ESG shocks on the industrial chain networks.
3.3 Industry-level ESG
We define an industry-level ESG rating based on the firmlevel ESG scores, which typically can be classified into nine grades, {AAA,AA,A,BBB,BB,B,CCC,CC,C}. An industrial node usually contains a number of firms and each firm is reported with an ESG score periodically. At present, there are no organizations or agents releasing ESG ratings for industries. On the other hand, we propose to define an industrial ESG score based on the affiliated firms' ESG scores. In particular, with the ESG grade vocabulary {AAA,AA,A,BBB,BB,B,CCC,CC,C}, we map a collection of firm-level ESG scores of the industrial node at time t to a fixed-length vector zt using the bag-of-words method. As shown in Figure 1, we let zt ∈ R9 be the ESG representation of an industry, and let Zt ∈ Rn×9 denote the industrial ESG level for all the industrial nodes at time t, where n is the number of industrial nodes.
Industrial ESG Shocks
With the industrial ESG defined above, we can calculate the industrial ESG shock at time t as the change of the ESG level [Serafeim et al., 2022]; that is, ∆Zt = Zt -Zt-1, and obviously, ∆Zt ∈ Rn×9 .
4 Methodology
4.1 Preliminaries
Let G = (V, E) be an industrial chain with n nodes, where V = {1, . . . , n} is the set of n nodes and E ⊆ V × V is the set of edges connecting paired nodes in V. The graph structure is represented by the n × n adjacency matrix A = {aij}ni,j=1 , where aij = 1 if there exists an edge eij ∈ E between nodes i and j, and aij = 0 otherwise. Suppose that graph G is associated with certain attributes, and we let X ∈ Rn×d denote the feature matrix of the n nodes and let y ∈ Rn be a target vector for the n nodes (e.g., y can be the profitability ratio or operating margin as detailed later).
4.2 Model
Cross-Attention GNN
The overall framework of the proposed cross-attention GNN can be represented by the following equations:
where Qt ∈ Rn×dq is a query vector for the n industry nodes at time t, K represents the matrix of keys, V is that of values, X is the original node features, andWK ∈ Rd×dk and WV ∈ Rd×dv are parameters associated with cross-attention. To perform a residual connection in Eq. (3), we set dv = d. In our model, we set dk = dq = dmodel, Z ∈ Rn×9 (∆Z) is the bag-of-words representation of ESG scores (shocks), and ⊙ is an element-wise product. The coefficient β0 ∈ Rn×dq is bias, and β1, β2 ∈ R9×dq link the ESG shocks to the query vector. For l = 1, . . . ,L, Hl ∈ Rn×dl is the hidden feature matrix of the l-th graph convolutional layer, Hli is its i-th row, N(i) denotes the neighborhood set of node i, g(·, ·;Wl ) is a linear mapping in the l-th layer with parameter Wl (i.e., Wl s are parameters in GNN), and Aggre{Hl-1 j |j ∈ N(i)} can be any standard graph convolutional operation. As a result, the overall framework contains three steps: (i) an autoregression for the current query Qt with the historical query and ESG shocks at time t - 1 (∆Zt-1 and Zt-1 ⊙∆Zt-1) corresponding to Eq. (1); (ii) a cross-attention module that aims to capture the interactions between the ESG shocks and industrial node features as given in Eqs. (2) and (3), where a residual connection is used in Eq. (3); and (iii) a subsequent standard GNN to integrate the ESG shocks into its messagepassing process as given in Eq. (4).
The cross-attention in Eqs. (2)-(3) quantifies how the ESG shocks affect the industrial network, which is an attention mechanism in the transformer architecture that mixes two different embedding sequences [Vaswani et al., 2017]. The two sequences can come from different modalities, such as text and image. Eqs. (2) and (3) calculate the cross-attention between the node features and the industrial ESG shocks.
As described earlier, the query Qt is calculated independently with a linear regression model, in which we choose industry-level ESG shocks and interaction terms as the explanatory variables. The rationale for this choice is that the interaction term between the ESG level Zt-1 and the change ∆Zt-1 as shown in Eq. (1) implies that a shock to the sustainable score will impact industries heterogeneously, which depends on not only the change but also the original rating. Firms with outstanding ESG credentials are at much higher risk to ESG scandals than those with already brown reputations, and the overall performance depends on its subordinate companies.
Graph Node Regression
With the hidden embedding HL output by the graph convolution as shown in Eq. (4), we conduct a graphical node regression task by minimizing
where f(·;W0 ) is a link function (e.g, a multi-layer perceptron andW0 represents the corresponding parameter), Θ := {WK ,WV ,Wl , βi}, where i = 0, 1, 2; l = 0, 1, . . . ,L.
In practice, many metrics can be defined to evaluate the performance of the industrial chain from different perspectives. In our problem, we link the hidden node embedding HL to two different tasks: the profitability ratio and operating margin.
Profitability Ratio (PR) . The PR is a financial metric that evaluates the ability of a company to generate income (profit) relative to the revenue during a specific period of time, which is defined as
Hence, we use the sum-up PR to measure the industry's earning power.
OperatingMargin (OM) . The OM is a ratio used to measure how well a company controls its cost. It is calculated through dividing the operating income by net sales, expressed in percentage,
Although the PR and OM are related to each other, they characterize the performance of the industry chain from two different view points. It would be desirable to draw consistent conclusions based on the experimental results using these two metrics.
5 Experiments
5.1 Experimental Setup
We split all industrial chain nodes with the ratio 7:1:2 into the training set, validation set, and test set. We use the historical industrial chain data in 2018-2019 to predict the next year's data. All experiments are replicated five times.
5.2 Datasets
Industrial Chain Dataset
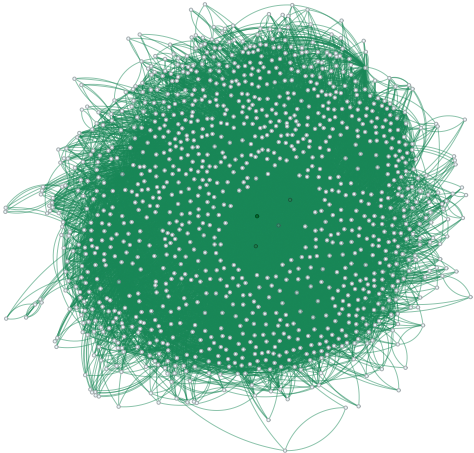
As shown in Figure 2, we collect the industrial chain data used on ChinaScope, including the supplier-customer relationship data and industrial node features in 2018-2020. With a total of 1164 industrial nodes, the adjacency matrix of the industrial chain is denoted by A ∈ R1164×1164 . Table 1 shows the basic statistics about the industrial chain. Each industrial node in the database can be identified with a unique product code. Usually, there are a number of listed companies associated with each industrial node. ChinaScope also reports the financial information for each firm, including the firm cost, profit, revenue, and HHI (Herfindahl-Hirschman Index 2 ). We sum up the costs, profits, revenues and HHIs of the companies associated with the same industry node to form the industrial costs, profits, revenues, and industrial HHIs, resulting in the industrial node feature matrix X ∈ R1164×4 . We calculate X with the original industrial chain data of 2018 and 2019, and use the PR and OM data in 2020 as the corresponding label y. Considering the different scales of each column of X, we perform normalization for the four features, which is conducted via subtracting the batch mean and divided by the standard deviation.
2 The Herfindahl-Hirschman index is a measure of the size of a firm in relation to the industry which is an indicator of the amount of competition among the firms.
| Statistics | Value |
|---|---|
| Number of Nodes | 1164 |
| Number of Edges | 38769 |
| Average Degree | 15.008 |
| Average Path Length | 3.558 |
| Diameter | 9 |
| Density | 0.013 |
Sino-Securities ESG Data
We use the ESG scores provided by Sino-Securities Index Information Service (Shanghai) Co. Ltd. The SinoSecurities ESG rating takes into account the reality of the Chinese capital market and the characteristics of various listed companies [Li et al., 2022a], and it measures ESG performance from four perspectives: ownership concentration, equity balances, executive shareholding, and institutional investor shareholding, resulting in nine-grade scores {AAA,AA,A,BBB,BB,B,CCC,CC,C}. The SinoSecurities ESG data cover ESG scores from 2009 to 2022 of all Chinese listed firms.
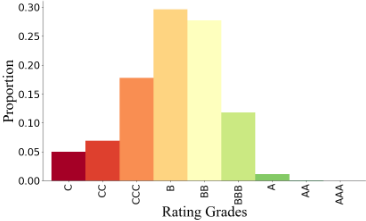
Figure 3 shows the distribution of Sino-Securities ESG ratings of all Chinese listed companies on December 31, 2019. Colors from red to green correspond to an ascending order of the ESG grades from C to AAA. Similar to a normal distribution, we observe that only a very small number of companies receiving top ratings of AAA, AA (ESG leaders) and bottom ratings C, CC (ESG laggards), while most of the companies receive average scores. We then calculate the industrial-level ESG Zt-1 and ESG shocks ∆Zt-1 with the Sino-Securities ESG data in 2018 and 2019 using the bag-of-words method.
5.3 EvaluationMetrics
As the loss function is based on the mean squared error (MSE), three other metrics are used to evaluate the prediction performance. Let y′i and yi be the predicted and ground-truth values, respectively, and let m be the total number of samples. The three evaluation metrics for regression are defined as follows,
- Root Mean Squared Error (RMSE):
- Mean Absolute Error (MAE):
- Mean Absolute Percentage Error (MAPE):
5.4 Overall Performance
Baseline Methods
We integrate cross-attention into a standard GNN framework as demonstrated in Eqs. (1)-(4). Suppose the effects of the ESG shocks do not exist; that is, Qt = 0, then Eq. (3) can be simplified as H0 = X. In this case, we can treat Eqs. (3) and
- as the baseline method, which is independent from Eqs. (1) and (2) (ESG shocks).
In the baseline methods, we choose four graph convolutional models as the aggregation function Aggre{Hl-1 j |j ∈ N(i)} in Eq. (4),
- Graph Convolutional Network (GCN) [Kipf and Welling, 2017],
- Graph Attention Network (GAT) [Veliˇckovi´c et al., 2018],
- ChebyNet [Defferrard et al., 2016],
- GraphSage [Hamilton et al., 2017].
We conduct two node regression tasks respectively on the profitability ratio and operating margin.
Results on Profitability Ratio
Table 2 summarizes the results of industrial node regression on the profitability ratio. We evaluate the regression performance on three commonly used metrics, RMSE, MAE, and MAPE with the corresponding standard deviations. The rows of "+ Cross-Attention" are the results of our methods using the graph aggregation of the baseline methods GCN, GAT, ChebyNet, and GraphSage, respectively. We can observe that (i) the proposed cross-attention methods achieve better performances on the industrial chain node's profitability ratio regression than the baselines; (ii) ChebyNet and GraphSage and the proposed methods with graph aggregation of ChebyNet and GraphSage achieve better results than GCN and GAT on the profitability ratio regression; and (iii) according to the three metrics, RMSE, MAE, and MAPE, GraphSage-based methods (including the baseline GraphSage and our method with GraphSage aggregation) make the best predictions.
Results on Operating Margin
Table 3 presents the results of the industrial node regression on another financial metric, the operating margin. The experimental setting of this task is the same as the previous task. From the results, we have similar observations: (i) the proposed methods in rows with "+ Cross-Attention" achieve better performances on the industrial chain node's operating margin regression than the baselines without the crossattention; and (ii) ChebyNet and GraphSage and the proposed methods with graph aggregation of ChebyNet and GraphSage achieve better performances than GCN and GAT, while the advantages of their performances on the three metrics RMSE, MAE, and MAPE are indistinguishable.
The ESG shocks are eliminated in the results given in rows 2, 4, 6, 8 (baselines) of both Tables 2 and 3. Therefore, by comparing the results between the baseline and the proposed methods in both Tables 2 and 3, we can draw a conclusion that the cross-attention mechanism can capture the effects of ESG on the profitability ratio and operating margin of industrial nodes.
5.5 Training Process
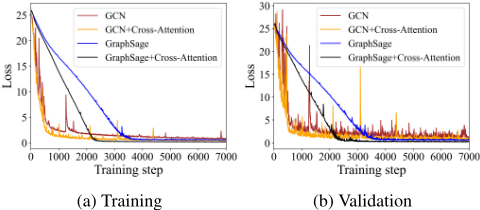
We further analyze the validation curves for model parameter selection. Figure 4 (a) exhibits the training losses for two baselines (GCN, GraphSage) and our corresponding models (GCN+Cross-Attention, GraphSage+Cross-Attention) over multiple epochs. We see that GCN/GCN+Cross-Attention converges faster than GraphSage/GraphSage+CrossAttention, while the latter two methods achieve relatively lower training losses. We have a similar observation in the validation curves as shown in Figure 4 (b). Furthermore, we find that GCN-based methods have more severe jitters or spikes than GraphSage-based methods in both the training and validation processes.
| RMSE | MAE | MAPE | |
|---|---|---|---|
| GCN | 0.0930±0.0372 | 0.0653±0.0259 | 0.0286±0.0111 |
| + CA | 0.0428±0.0092 | 0.0299±0.0060 | 0.0132±0.0026 |
| GAT | 0.0777±0.0467 | 0.0593±0.0391 | 0.0262±0.0173 |
| + CA | 0.0368±0.0074 | 0.0234±0.0049 | 0.0103±0.0022 |
| ChebyNet | 0.0192±0.0069 | 0.0066±0.0022 | 0.0029±0.0009 |
| + CA | 0.0126±0.0019 | 0.0059±0.0008 | 0.0026±0.0004 |
| GraphSage | 0.0193±0.0078 | 0.0078±0.0019 | 0.0034±0.0008 |
| + CA | 0.0106±0.0039 | 0.0057±0.0022 | 0.0025±0.0010 |
| RMSE | MAE | MAPE | |
|---|---|---|---|
| GCN | 1.7760±0.5336 | 0.6510±0.2045 | 0.0949±0.0306 |
| + CA | 0.8565±0.3268 | 0.5307±0.1772 | 0.0768±0.0253 |
| GAT | 1.5951±0.5256 | 1.1058±0.4041 | 0.1577±0.0507 |
| + CA | 0.8524±0.1517 | 0.5493±0.1436 | 0.0789±0.0219 |
| ChebyNet | 0.4902±0.0842 | 0.1780±0.0259 | 0.0229±0.0043 |
| + CA | 0.2960±0.1054 | 0.1076±0.0161 | 0.0140±0.0018 |
| GraphSage | 0.4693±0.1260 | 0.2616±0.0853 | 0.0374±0.0162 |
| + CA | 0.2868±0.1135 | 0.1455±0.0413 | 0.0201±0.0063 |
By comparing the training and validation processes between the baselines and our methods, we observe that the cross-attention module can help to improve the training and validation curves from two perspectives: (i) It improves the stability of learning processes, as the learning curves with cross-attention are smoother than those without crossattention; (ii) It helps the proposed cross-attention GNNs to achieve lower losses than the traditional GNNs (e.g., GCN, GraphSage).
5.6 Regression Parameters Analysis
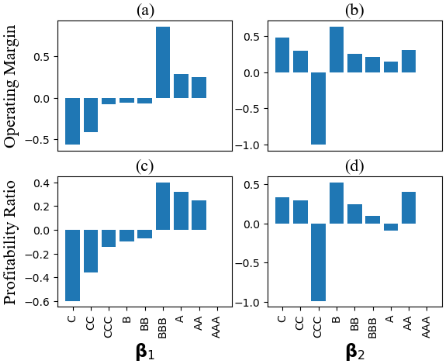
To visualize the regression parameters β1 and β2 in Eq. (1), we note the rows of βi, i ∈ {1, 2}, correspond to the nine grades of the ESG rating
{AAA,AA,A,BBB,BB,B,CCC,CC,C}. For the convenience of visualization, we plot the row summation of βi, i ∈ {1, 2}, with respect to the operating margin and profitability ratio as shown in Figure 5. Figure 5 (a) and (c) for β1 and Figure 5 (b) and (d) for β2 depict the contributions of ∆Zt-1 and Zt-1 ⊙∆Zt-1 in our model, respectively. We see that β1 and β2 are consistent on the two node regression tasks. The heights of the ninth (invisible) bars in Figure 5 (a)-(b) are all zero because there are almost no companies with the AAA grade in the data.
5.7 AttentionMap
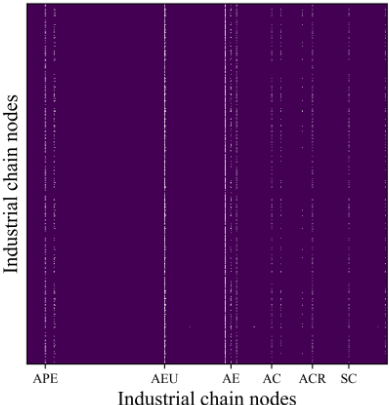
The results in Tables 2 and 3 have demonstrated that the ESG shocks indeed affect the industrial chain's performance. We explain how ESG affects the industrial chain from the view of the attention map in Eq. (3). The original values in the attention map M = QtK⊤ are smooth among different industrial nodes. To make their differences more distinguishable, we sharpen the attention weight matrix as exp{100(M- 1n (M1) ⊗ 1⊤}, where ⊗ denotes the Kronecker product, 1 is an n-dimensional vector of 1s. In the processed attention map as visualized in Figure 6, we have an interesting observation that automobile-related industries have been selected out from the 1164 industries. It can be easily interpreted as follows: (i) The automobile is the most representative of the high-end manufacturing industry, which affects and connects with almost all other basic industries; and (ii) As the biggest developing country, the automobile manufacturing related industries in China account for almost one-tenth of the total industrial output.
6 Conclusion
The impacts of the environmental, social, and governance (ESG) on the financial market have been examined by many studies. However, how the ESG rating affects the macroeconomy is still unknown. From the view of the whole industrial chain, we model the ESG shocks on the performance of the industrial chain with the cross-attention mechanism. The ESG shocks are taken to produce queries (Qt) while the industrial node features are linked to keys (K) and values (V). We use a standard GNN to predict the industrial node's performance with the filtered values. The proposed cross-attention GNN can predict industrial node performance accurately with ESG shocks. Moreover, the attention map can explain how the ESG rating impacts the development of the industrial chain. As a conclusion, the GNN using crossattention is a valuable tool to model the ESG shocks on the whole industrial chain.
Acknowledgements
This work was partially supported by the National Social Science Fund of China (21BJY081), the Undergraduate Research and Learning Program of Southwestern University of Finance and Economics, and Jiaozi Institute of Fintech Innovation, Southwestern University of Finance and Economics.
@inproceedings{ijcai2023p674,
  title     = {Interpret ESG Rating’s Impact on the Industrial Chain Using Graph Neural Networks},
  author    = {Liu, Bin and He, Jiujun and Li, Ziyuan and Huang, Xiaoyang and Zhang, Xiang and Yin, Guosheng},
  booktitle = {Proceedings of the Thirty-Second International Joint Conference on
               Artificial Intelligence, {IJCAI-23}},
  publisher = {International Joint Conferences on Artificial Intelligence Organization},
  editor    = {Edith Elkind},
  pages     = {6076--6084},
  year      = {2023},
  month     = {8},
  note      = {AI for Good},
  doi       = {10.24963/ijcai.2023/674},
  url       = {https://doi.org/10.24963/ijcai.2023/674},
}
TY - CPAPER TI - Interpret ESG Rating’s Impact on the Industrial Chain Using Graph Neural Networks AU - Liu, Bin AU - He, Jiujun AU - Li, Ziyuan AU - Huang, Xiaoyang AU - Zhang, Xiang AU - Yin, Guosheng T2 - Proceedings of the Thirty-Second International Joint Conference on Artificial Intelligence, IJCAI-23 PB - International Joint Conferences on Artificial Intelligence Organization PY - 2023 SP - 6076 EP - 6084 DO - 10.24963/ijcai.2023/674 UR - https://doi.org/10.24963/ijcai.2023/674 ER -Copied
Machine-readable versions of this paper, for tools and AI agents:





