
Preventing Attacks in Interbank Credit Rating with Selective-aware Graph Neural Network
Proceedings of the Thirty-Second International Joint Conference on Artificial Intelligence. AI for Good. Pages 6085-6093.
https://doi.org/10.24963/ijcai.2023/675
Keywords
- AI for Good: Multidisciplinary Topics and Applications
- AI for Good: Data Mining
Abstract
Accurately credit rating on Interbank assets is essential for a healthy financial environment and substantial economic development. But individual participants tend to provide manipulated information in order to attack the rating model to produce a higher score, which may conduct serious adverse effects on the economic system, such as the 2008 global financial crisis. To this end, in this paper, we propose a novel selective-aware graph neural network model (SA-GNN) for defense the Interbank credit rating attacks. In particular, we first simulate the rating information manipulating process by structural and feature poisoning attacks. Then we build a selective-aware defense graph neural model to adaptively prioritize the poisoning training data with Bernoulli distribution similarities. Finally, we optimize the model with weighed penalization on the objection function so that the model could differentiate the attackers. Extensive experiments on our collected real-world Interbank dataset, with over 20 thousand banks and their relations, demonstrate the superior performance of our proposed method in preventing credit rating attacks compared with the state-of-the-art baselines.
- Year Method 0% 5% 10% 15% 20% 25% GCN 49.62 46.34 44.60 44.18 43.67 43.59 GAT 50.89 48.89 45.22 45.64 43.83 44.72 2016 RGCN 55.55 53.29 49.59 47.17 45.53 44.48 Pro-GNN 54.88 49.98 49.90 48.29 46.03 45.65 SA-GNN 56.07 55.88 54.53 53.89 52.16 51.93 GCN 51.06 50.39 48.68 48.92 48.34 47.98 GAT 51.89 50.15 49.59 49.38 49.55 49.29 2017 RGCN 52.17 51.57 49.62 49.24 48.20 47.61 Pro-GNN 52.11 50.16 50.87 45.63 46.37 47.94 SA-GNN 52.73 52.65 52.58 52.48 52.40 51.05 GCN 47.16 45.24 45.08 45.22 44.79 43.61 GAT 48.20 47.62 47.46 45.44 45.85 44.41 2018 RGCN 48.29 47.99 47.33 45.81 45.94 45.09 Pro-GNN 48.85 48.05 47.78 45.91 45.57 45.20 SA-GNN 49.59 49.47 48.94 47.78 47.24 46.23 GCN 55.21 53.07 51.67 50.85 49.89 49.98 GAT 57.60 54.32 53.64 52.38 51.49 50.67 2019 RGCN 56.02 54.18 52.86 50.82 50.08 50.28 Pro-GNN 53.83 49.45 47.74 46.59 49.11 48.65 SA-GNN 62.41 62.37 62.34 60.16 60.07 58.76
- [Agarwal et al., 2021] Rishabh Agarwal, Levi Melnick, Nicholas Frosst, Xuezhou Zhang, Ben Lengerich, Rich Caruana, and Geoffrey E Hinton. Neural additive models: Interpretable machine learning with neural nets. Advances in Neural Information Processing Systems, 34:4699-4711, 2021.
- [Anand et al., 2015] Kartik Anand, Ben Craig, and Goetz Von Peter. Filling in the blanks: Network structure and in- terbank contagion. Quantitative Finance, 15(4):625-636, 2015.
- [Becker and Milbourn, 2011] Bo Becker and Todd Mil- bourn. How did increased competition affect credit rat- ings? Journal of financial economics, 101(3):493-514, 2011.
- [Bhatore et al., 2020] Siddharth Bhatore, Lalit Mohan, and Y Raghu Reddy. Machine learning techniques for credit risk evaluation: a systematic literature review. Journal of Banking and Financial Technology, 4:111-138, 2020.
- [Brunnermeier, 2009] Markus K Brunnermeier. Deciphering the liquidity and credit crunch 2007-2008. Journal of Eco- nomic perspectives, 23(1):77-100, 2009.
- [Cheng et al., 2019] Dawei Cheng, Yi Tu, Zhen-Wei Ma, Zhibin Niu, and Liqing Zhang. Risk assessment for networked-guarantee loans using high-order graph atten- tion representation. In IJCAI, pages 5822-5828, 2019. IJCAI
- [Cheng et al., 2020] Dawei Cheng, Xiaoyang Wang, Ying Zhang, and Liqing Zhang. Risk guarantee prediction in networked-loans. In IJCAI International Joint Conference on Artificial Intelligence, 2020. IJCAI
- [Cheng et al., 2021] Dawei Cheng, Chen Chen, Xiaoyang Wang, and Sheng Xiang. Efficient top-k vulnerable nodes detection in uncertain graphs. IEEE Transactions on Knowledge and Data Engineering, 2021.
- [Cheng et al., 2022] Dawei Cheng, Zhibin Niu, Jie Li, and Changjun Jiang. Regulating systemic crises: Stemming the contagion risk in networked-loans through deep graph learning. IEEE Transactions on Knowledge and Data En- gineering, 2022.
- [Dai et al., 2018] Hanjun Dai, Hui Li, Tian Tian, Xin Huang, Lin Wang, Jun Zhu, and Le Song. Adversarial attack on graph structured data. In International conference on ma- chine learning, pages 1115-1124. PMLR, 2018. [des Règlements Internationaux, 1992] Banque des Règlements Internationaux. Recent developments in international interbank relations. Working Group of the Central Banks of the GIO, 1992.
- [Dittrich, 2007] Fabian Dittrich. The credit rating industry: competition and regulation. Available at SSRN 991821, 2007.
- [Elsinger et al., 2013] Helmut Elsinger, Alfred Lehar, and Martin Summer. Network models and systemic risk as- sessment. Handbook on Systemic Risk, 1(1):287-305, 2013.
- [Entezari et al., 2020] Negin Entezari, Saba A Al-Sayouri, Amirali Darvishzadeh, and Evangelos E Papalexakis. All you need is low (rank) defending against adversarial at- tacks on graphs. In Proceedings of the 13th International Conference on Web Search and Data Mining, pages 169- 177, 2020.
- [Feng et al., 2022] Bojing Feng, Haonan Xu, Wenfang Xue, and Bindang Xue. Every corporation owns its structure: Corporate credit rating via graph neural networks. In Pat- tern Recognition and Computer Vision: 5th Chinese Con- ference, PRCV 2022, Shenzhen, China, November 4-7, 2022, Proceedings, Part I, pages 688-699. Springer, 2022.
- [Golbayani et al., 2020a] Parisa Golbayani, Ionut ¸Florescu, and Rupak Chatterjee. A comparative study of forecast- ing corporate credit ratings using neural networks, support vector machines, and decision trees. The North American Journal of Economics and Finance, 54:101251, 2020.
- [Golbayani et al., 2020b] Parisa Golbayani, Dan Wang, and Ionut Florescu. Application of deep neural networks to assess corporate credit rating. arXiv preprint arXiv:2003.02334, 2020.
- [Gyntelberg and Wooldridge, 2008] Jacob Gyntelberg and Philip D Wooldridge. Interbank rate fixings during the re- cent turmoil. BIS Quarterly Review, March, 2008.
- [Ioannidis et al., 2010] Christos Ioannidis, Fotios Pasiouras, and Constantin Zopounidis. Assessing bank soundness with classification techniques. Omega, 38(5):345-357, 2010.
- [Jin et al., 2020] Wei Jin, Yao Ma, Xiaorui Liu, Xianfeng Tang, Suhang Wang, and Jiliang Tang. Graph structure learning for robust graph neural networks. In Proceedings of the 26th ACM SIGKDD international conference on knowledge discovery & data mining, pages 66-74, 2020.
- [Kipf and Welling, 2016] Thomas N Kipf and Max Welling. Semi-supervised classification with graph convolutional networks. arXiv preprint arXiv:1609.02907, 2016.
- [Lee, 2007] Young-Chan Lee. Application of support vec- tor machines to corporate credit rating prediction. Expert Systems with Applications, 33(1):67-74, 2007.
- [Macchiati et al., 2022] Valentina Macchiati, Giuseppe Brandi, Tiziana Di Matteo, Daniela Paolotti, Guido Cal- darelli, and Giulio Cimini. Systemic liquidity contagion in the european interbank market. Journal of Economic Interaction and Coordination, 17(2):443-474, 2022.
- [McPherson et al., 2001] Miller McPherson, Lynn Smith- Lovin, and James M Cook. Birds of a feather: Homophily in social networks. Annual review of sociology, 27(1):415- 444, 2001.
- [Meng et al., 2017] Xiangfeng Meng, Yunhai Tong, Xinhai Liu, Yiren Chen, and Shaohua Tan. Netrating: Credit risk evaluation for loan guarantee chain in china. In Intelli- gence and Security Informatics: 12th Pacific Asia Work- shop, PAISI 2017, Jeju Island, South Korea, May 23, 2017, Proceedings 12, pages 99-108. Springer, 2017.
- [Nier et al., 2007] Erlend Nier, Jing Yang, Tanju Yorul- mazer, and Amadeo Alentorn. Network models and finan- cial stability. Journal of Economic Dynamics and Control, 31(6):2033-2060, 2007.
- [Niu et al., 2020] Zhibin Niu, Runlin Li, Junqi Wu, Dawei Cheng, and Jiawan Zhang. iconviz: Interactive visual exploration of the default contagion risk of networked- guarantee loans. In 2020 IEEE conference on visual ana- lytics science and technology (VAST), pages 84-94. IEEE, 2020.
- [Sheldon et al., 1998] George Sheldon, Martin Maurer, et al. Interbank lending and systemic risk: An empirical analysis for switzerland. Revue suisse d economie politique et de statistique, 134:685-704, 1998.
- [Sun et al., 2022] Lichao Sun, Yingtong Dou, Carl Yang, Kai Zhang, Ji Wang, S Yu Philip, Lifang He, and Bo Li. Adversarial attack and defense on graph data: A survey. IEEE Transactions on Knowledge and Data Engineering, 2022.
- [Tang et al., 2020] Xianfeng Tang, Yandong Li, Yiwei Sun, Huaxiu Yao, Prasenjit Mitra, and Suhang Wang. Transfer- ring robustness for graph neural network against poison- ing attacks. In Proceedings of the 13th international con- ference on web search and data mining, pages 600-608, 2020.
- [Veličković et al., 2017] Petar Veličković, Guillem Cucurull, Arantxa Casanova, Adriana Romero, Pietro Lio, and Yoshua Bengio. Graph attention networks. arXiv preprint arXiv:1710.10903, 2017.
- [Wallis et al., 2019] Mark Wallis, Kuldeep Kumar, and Adrian Gepp. Credit rating forecasting using machine learning techniques. In Managerial perspectives on in- telligent big data analytics, pages 180-198. IGI Global, 2019.
- [Wu et al., 2019] Huijun Wu, Chen Wang, Yuriy Tyshetskiy, Andrew Docherty, Kai Lu, and Liming Zhu. Adversarial examples on graph data: Deep insights into attack and de- fense. arXiv preprint arXiv:1903.01610, 2019.
- [Zhu et al., 2019] Dingyuan Zhu, Ziwei Zhang, Peng Cui, and Wenwu Zhu. Robust graph convolutional networks against adversarial attacks. In Proceedings of the 25th ACM SIGKDD international conference on knowledge discovery & data mining, pages 1399-1407, 2019.
- [Zügner et al., 2018] Daniel Zügner, Amir Akbarnejad, and Stephan Günnemann. Adversarial attacks on neural net- works for graph data. In Proceedings of the 24th ACM SIGKDD international conference on knowledge discov- ery & data mining, pages 2847-2856, 2018. IJCAI
References were extracted automatically from the PDF and may contain errors.
Full text extracted automatically from the PDF; figures, tables and equations may differ. The PDF is the version of record.
1 Introduction
International interbank relations have undergone significant changes in recent years as a result of the development of new financial instruments, advances in artificial intelligence technology, regulatory developments, etc [des R`eglements Internationaux, 1992; Macchiati et al., 2022]. Most notably, modern financial operations involving derivative instruments have altered the role of conventional interbank loan markets [Nier et al., 2007]. Therefore, it is far from satisfactory to only consider their own financial statements in the Interbank credit rating [Brunnermeier, 2009]. How to develop an accurate rating method capable of modern financial situations is crucially important for building a stable economic development and preventing systemic financial crises.
∗Corresponding Author
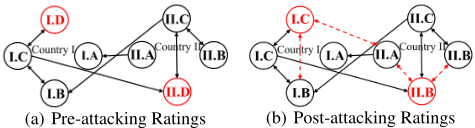
However, each participant is always eager to achieve a higher score by the credit rating model [Gyntelberg and Wooldridge, 2008]. It has been reported [Dittrich, 2007; Becker and Milbourn, 2011] that some banks provide dishonest financial information for a higher rating, such as tampering with financial statements, exaggerating their reports, or creating false loan relationships with high-ranking banks. Figure 1 illustrates a typical credit rating attack process. The A-D (high-low) denotes the rating level. The red node I.D (Figure 1a) attacks the rating model by artificially tampering with its features and creating false relations with higher credit banks (I.B and II.A). Consequently, I.D (Figure 1a) successfully misled the model to produce rank C (red node I.C in Figure 1b) based on the attacked features and structures. A similar attack was issued by II.D (Figure 1a) and deceived the model promote to rank B (red node II.B in Figure 1b).
Recently, in order to accurately model Interbank relations, graph neural networks (GNNs) have been widely utilized for credit ratings [Golbayani et al., 2020a; Agarwal et al., 2021] and achieve more promising improvements compared with conventional machine learning-based rating models [Wallis et al., 2019; Bhatore et al., 2020], such as logistic regression, support vector machine [Lee, 2007]. For instance, HGAR [Cheng et al., 2019] learns the embedding of loan networks by high-order adjacent measures and a graph attention layer, and CCR-GNN [Feng et al., 2022] applies GNN for credit rating with a graph-level perspective. However, there is still a blank area for the research community that addresses preventing attacks on GNN-based credit rating models.
Existing researches about preventing attacks on graph neural network mainly only focus on the feature attack or the structural attack [Sun et al., 2022]. For example, [Entezari et al., 2020] and Pro-GNN [Jin et al., 2020] use the low rank to pre-process the graph and learn. RGCN [Zhu et al., 2019] models the Gaussian distribution as a hidden layer in order to absorb the impact of adversarial attacks in the variance. PA-GNN [Tang et al., 2020] instead learned the supervision knowledge from clean graphs. But existing works failed to treat the joint poisoning attacks of both data tampering and fake relations, named feature and structural joint poisoning attacks, which face significant limitations in the Interbank credit rating attacks problem.
Therefore, we propose a novel selective-aware graph neural network model (SA-GNN) for simultaneously defending the feature attack and structural attack of Interbank credit rating. Specifically, the model builds a selective representation layer, and explores the label similarity and the feature similarity, to adaptively prioritize the poisoning training data with Bernoulli distribution similarities and simulate a clean graph. This is due to the fact that, when graphs are attacked, their structures and node attributes are typically abnormal compared to existing ones, leading to adverse effects on the classification process. By learning and optimizing, simulating a clean graph with these abnormal nodes removed can enhance the robustness. Finally, we optimize the model with weighed penalization on the objection function so that the model could differentiate the attackers. To evaluate the model, we conducted experiments on a global bank dataset to predict credit ratings and obtained further insight. The contributions of this paper are summarized as follows:
- Objective and accurate rating of financial institutions' credit risk is critical for a healthy market environment and economic development. To the best of our knowledge, this is the first work that addresses the Interbank credit rating attack problem by proposing a novel selective-aware graph neural network model.
- We simulate the rating information manipulating process by structural and feature poisoning attacks. Then we adaptively prioritize the poisoning training representations with Bernoulli distribution similarities and devise a penalized loss function in the joint optimization process so that the model could differentiate the attackers.
- We evaluated our method on a real-world ten years global Interbank dataset. Extensive experiments show that our proposed method significantly outperforms the compared state-of-the-art baselines in the Interbank credit rating attacks. The sources of our approach will be available on Github 1 .
2 Preliminaries
2.1 Interbank Network
The process of risk contagion between banks can be quite complex, but network analysis can provide an effective way to characterize it. Increasingly, studies are focusing on the development of Interbank market networks to identify risk contagion between banks, with banks as nodes and Interbank lending quotas matrix as network links. Consider a system where N banks participate in Interbank lending. Matrix X ∈ [0,∞)N×N represents the total Interbank position, where the typical element Xij represents the amount lent by bank i to bank j. Such networks are directed and valuable. For each bank i, the row sum of X represents the total Interbank assets Ai = ∑Nj=1 Xij , and the column sum represents the Interbank liabilities Li = ∑Nj=1 Xji.
1 https://github.com/finint/interbank
Given the inability of banks to report their bilateral exposures, there is a need for a reliable method of inferring Interbank borrowing limits. Existing studies mostly infer the Interbank borrowing limits matrix reasonably through the maximum entropy principle, which indicates that under the condition of incomplete information of objects, the maximum uncertainty should be maintained to estimate the most reasonable probability distribution. Sheldon and Maurer were the first to apply the concept when studying Interbank lending, proposing that the disorder degree of the Interbank limit matrix should be maximized given incomplete information of bank transactions [Sheldon et al., 1998]. The standard method in literature is the Maximum Entropy estimation matrix [Elsinger et al., 2013], which disperses the risk exposure as evenly as possible and is consistent with the margin, thereby filling all the cells among the active banks.
The Interbank lending network constructed based on the maximum entropy principle is completely connected, such that each bank maintains lending transactions with all other banks. However, in reality, most banks only maintain lending links with a few banks due to the high cost of information processing, risk management, and reputation checks. To address this issue, [Anand et al., 2015] proposed the minimum density method. In contrast to maximum entropy, this method takes into account the economic rationale that Interbank linkages are expensive to maintain. The minimum density method seeks to identify the most probable links and assigns the largest allowable exposures to them, consistent with the total lending and borrowing banking balance sheet. This method can be expressed as a constrained optimization problem of matrix Z,
However, we encountered several issues when implementing this method for large bank datasets, as it took up a lot of time and space to solve them. To optimize this process, we focused on the most time-consuming task of calculating the matrix, according to the asset and liability, and sampling the probability of its values (both complexities O(n2 )). We realized that we only needed to update one row or column when a number was modified in either the asset or liability sequence. Sampling was essentially querying the matrix prefix. Consequently, we considered using a Binary Index Tree (BIT) to maintain the matrix, which can be modified and queried in a single point complexity of O(logn). This feature enabled us to reduce the complexity of calculation and sampling to O(n · logn) and O(logn · logn), respectively.
2.2 ProblemDefinition
In this paper, a graph G is defined as G = (V, E), where V = {v1, v2, . . . , vN} represents the set of nodes, with N = |V | being the number of nodes, and E is the set of edges between nodes. The adjacency matrix A ∈ RN×N is a representation of the graph, with Aij denoting the relationship between nodes vi and vj. Furthermore, X = {x1, x2, . . . , xN} ∈ RN×d is the node characteristic matrix, with each characteristic vector xi and a total of d nodes characteristics. Therefore, the graph can also be represented as G = (A,X). In common node classification settings, only a subset of nodes VL = {v1, v2, . . . , vL} are labeled YL = {y1, y2, . . . , yL}, with the label yi of node vi.
In previous studies, structural attacks were often emphasized while feature attacks were ignored, and we hope to consider both of these attacks comprehensively. In terms of structural attack, research shows it tends to add antagonistic edges connecting nodes with different characteristics. Thus, for each class of rated nodes, connections with nodes of the same rating are established with a fixed probability a. We have also considered feature attacks, taking into account the social conditions and economic principles that make banks strive to improve their ratings. In this instance, each type of rating node is randomly attracted to the average features of the previous rating with a fixed probability a.
Through the definitions mentioned above, the problem to be solved can be formally expressed as follows: Given G = (A, X), learn the perturbed graph structure and features so as to improve the node classification performance of unmarked nodes from the adjacency matrix A and feature matrix X.
3 The Proposed Framework
3.1 Model Architecture
In order to defend against both feature and structure attacks, a natural strategy is to eliminate the carefully designed disturbance to restore the original graph features and structure, thus protecting against adversarial interference. We propose the SA-GNN model, aiming at learning and simulating the clean graph structure of several independent selection layers, exploring the feature similarity and label similarity of the graph, and integrating optimization to achieve this goal.
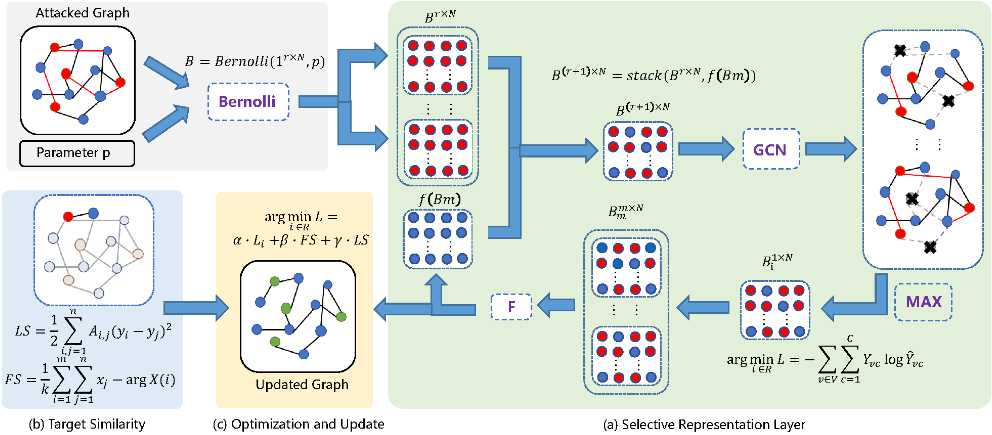
The proposed framework is illustrated in Figure 2, wherein black edges represent regular edges, blue nodes are regular nodes, and red edges and nodes denote adversarial elements which reduce performance. To defend against these attacks, SA-GNN leverages the stored best matrix by several independent selection layers and optimizes, thus reconstructing a clean graph. This process allows it to consider feature similarity and label similarity in order to reduce the effect of the feature and structural attack. In addition, SA-GNN feeds the reconstructed graphs into its optimization problem, which it reiterates and optimizes as needed. The details of the proposed framework are described in the following subsections.
3.2 Selective Representation Layer
To defend against the feature attack, it is a natural and effective strategy to delete the attacked node. We introduce a Boolean matrix Br×N ∈ {True, False} to code whether a node in G is removed. That is, node ij is removed if Bij = True. Otherwise, if node ij is reserved, Bij = False. For improved performance, we propose a selective representation layer. This layer filters out clean nodes during random and independent removal, and executes r independent runs of GNN during each iteration of training, using a set of values R = {1, 2, ..., r}. To ensure each node has a fixed probability p of removal, independent of all other nodes, a Bernoulli distribution of p is used with the Boolean matrix. Then the drop part of matrix X[B] = 0sum(B)×d , where
Though there exist several different GNN methods, in this work, we focus on GCN [Kipf and Welling, 2016] and GAT [Veliˇckovi´c et al., 2017]. Note that it is straightforward to extend the proposed framework to other GNN models. Specifically,a two-layer GCN with θ = (W1,W2) implements as:
where ˜ A = A+IN and ˜D is the diagonal matrix of A+I with ˜Dii = ∑j ˜ Aij. σ is the activation function such as ReLU.
For the hidden layer, the attention mechanism is introduced to weighted sum the features of adjacent nodes, where αi,j is the attention coefficient, K is the number of attention heads, and -→h′ i is the node output characteristic.
For the result of r independent runs in each epoch, we need to identify the one with the smallest difference between the predicted and true values and save its Boolean matrix. We can do this by passing X to a softmax function so as to obtain the predicted label, ˆ Y = softmax(X),X = [x1, x2, ..., xr]. The cross-entropy loss be like:
where V is the set of nodes, C is the number of classes, Y is the label matrix, and ˆ Y is the prediction by passing representation in the final layer to a softmax function.
We use r to represent the number of runs per epoch, and the total number of runs in m rounds of iterations is m · r. This is large enough to ensure that the observed set sufficiently covers all possible adversarial attacks. Given an attack ratio a, number of ncodes n, and removal probability p, the probability of accurately simulating the actual attack is: ( n n·a) · pn·a · (1-p)n(1-a) . In this case, we want the value of m and r to meet:
Therefore, the probability of simulation accuracy closely follows the cost-benefit optimization of parameters. This is very difficult when the dataset is large. So we consider adopting an aggregation method to optimize and solve the problem. We suggest an additional step to merge a total of m matrices saved at each round into a single matrix, which is then used as the current optimal matrix in the next epoch.
Assuming that Bm is the optimal Boolean matrix saved in the mth round, then in the m+ 1th round, the input matrix is Splicing of Br×N and the aggregation of B1,B2, ...,Bm, where M = {1, 2, ..., m}, f is a nonlinear transformation and F is the stack function.
By using the aggregation method, we can gain more precise results and improve the overall quality of the simulation.
3.3 Target Similarity
To defend against structural attacks, we aim to ensure the similarity in the learned graph. Research shows that connected nodes in graphs are likely to share similar features [McPherson et al., 2001], which has been validated in many domains. For instance, connected nodes often share similar attributes in recommender systems and social networks.
Similarly, in the Interbank network, connected banks often have the same or just one-grade different tag ratings. Meanwhile, if two nodes have similar target variables, the message passing between them improves the performance of the graph neural network, so we hope that the target similarity is as small as possible. In order to achieve this goal, we propose using LS to describe the label similarity. Thus, we expect LS to be as small as possible, that is, the cost function can serve as an effective strategy to minimize the label similarity between connected nodes.
We also consider the similarity of node features under the same label. Such groupings are largely due to similar features, so we can confidently assert that the features of nodes under the same label are similar to some level. In order to measure this feature similarity, we use a feature selection FS algorithm to calculate the difference between these nodes and the feature mean value for all nodes labeled with i, where k is a super parameter.
In order to achieve feature similarity and label similarity in the learning graph, we should minimize FS and LS. Therefore, we can add them to the objective function to punish those with higher values.
Algorithm 1 The training framework of SA-GNN
Input: Graph G = (V, E), Feature Matrix X, Label Y
Parameter: Hyper-parameters p, Number of Layers L,
Number of Hidden Layers Lh
Output: Updated Graph G′ , Predict Credit Rating Y ′
- 1: Initialize all parameters.
- 2: while Stopping condition is not met do
- 3: Selective represent nodes at p rate using Eq.(3)
- 4: Merge all saved matrices B using Eq.(9)
- 5: for l ← 2 to L do
- 6: Calculate X[B](l) using Eq. (4)
- 7: for l ← 2 to Lh do
- 8: Calculate X[B](l) using Eq. (6)
- 9: end for
- 10: end for
- 11: Compare using Eq.(7) and save the best matrix
- 12: Calculate label similarity LS using Eq.(10)
- 13: Calculate feature similarity FS using Eq.(11)
- 14: Calculate L using Eq.(12)
- 15: end while
3.4 Objective Function and Optimization
There are multiple loss components in the overall solution of SA-GNN. So, we form the final loss function of SA-GNN by taking a linear combination of all as shown below:
among α, β, and γ are predefined parameters used to control the contribution of various parts in the objective function.
Once we obtain the best Boolean matrix B of the reconstructed adjacency graph after optimizing Equation 5, we integrate all the previously stored optimal matrices for the next iteration of SA-GNN. The pseudo-code of SA-GNN is presented in Algorithm 1.
In each iteration of the process, SA-GNN randomly generates r Boolean matrices to cover potential adversarial attacks as comprehensively as possible. The matrices are then integrated with the optimal ones from the previous rounds and tested separately. In graph training, the algorithm uses two GCN layers in conjunction with a GAT hidden layer. Additionally, feature similarity and label similarity penalty mechanisms are used to penalize nodes for any inconsistencies that may appear. This adds to the optimization of the target function. Overall, the proposed SA-GNN model aims to create a secure environment for GNN by covering a wider range of potential attacks and punishing nodes for any discrepancies that may arise.
4 Experiments
4.1 Experimental Settings
In this section, we empirically evaluate the effectiveness of our proposed method. We first introduce the experimental settings and then present our experimental results.
Datasets
We collected data from seven kinds of banks worldwide between 2011 and 2020 to study the attack and defense of Interbank networks, including commercial banks, savings banks, cooperative banks, real estate & mortgage banks, investment banks, Islamic banks, and central banks. After the screening, 14,272 pieces of data were finally obtained each year, totaling 142,720 pieces of data.
Our analysis was based on a careful selection of indicators across three categories: (1) basic information (Name, Address, Bvd id); (2) basic items (Assets, Liabilities, and Buffers); and (3) change rates (impaired Impaired loans / Gross customer loans & advances (%), Loan loss reserves / Impaired loans (%), Customer loans & advances / Total assets (%), Net charge offs (NCOs) / Average gross customer loans & advances (%), Unreserved impaired loans / Equity (%)). With these data, we constructed a financial network and investigated the relationship between propagation attacks and defense strategies.
Attack Methods
We compare these models and our proposed model under two attacking methods:
- Feature Attack: We randomly select nodes and modify their features which tend to be higher-level labels.
- Structural Attack: We randomly select nodes and generate fake edges of nodes with higher-level labels.
Baselines
To evaluate our model, we compare it with the state-of-the-art GNN and defense models.
- GCN: this is the original GCN model which defines the graph convolution as aggregating features from neighborhood nodes.
- GAT: Graph Attention Network (GAT) is composed of attention layers that can learn different weights to different nodes in the neighborhood. It is often used as a baseline to defend against adversarial attacks.
- RGCN: RGCN models node representations as Gaussian distributions to absorb the effects of adversarial attacks. It also employs an attention mechanism to penalize nodes with high variance.
- Pro-GNN: Pro-GNN learns clean graph structure from disturbance graph and GNN parameters at the same time to defend against adversarial attacks.
Parameter Settings
In the experiment, we set the number of layers of all methods to 2 according to the previous suggestions [Veliˇckovi´c et al., 2017]. For GCN, RGCN, Pro-GNN, and SA-GNN, we set the number of hidden cells to 256. For GAT, we use 8 attention headers, each of which contains 8 features, namely 64 hidden units suggested by the author. For SA-GNN, the super parameters are set as follows: α = 0.7, β = 0.2, γ = 0.1, r = 2, and p is adjusted from {0.05, 0.1, 0.15, 0.2, 0.25, 0.3}. For optimization, we use Adam, the fixed learning rate is 0.01, and the epoch is set to 1000.
| Year | Method | 0% | 5% | 10% | 15% | 20% | 25% |
|---|---|---|---|---|---|---|---|
| 2016 | GCN | 49.62 | 46.34 | 44.60 | 44.18 | 43.67 | 43.59 |
| GAT | 50.89 | 48.89 | 45.22 | 45.64 | 43.83 | 44.72 | |
| RGCN | 55.55 | 53.29 | 49.59 | 47.17 | 45.53 | 44.48 | |
| Pro-GNN | 54.88 | 49.98 | 49.90 | 48.29 | 46.03 | 45.65 | |
| SA-GNN | 56.07 | 55.88 | 54.53 | 53.89 | 52.16 | 51.93 | |
| 2017 | GCN | 51.06 | 50.39 | 48.68 | 48.92 | 48.34 | 47.98 |
| GAT | 51.89 | 50.15 | 49.59 | 49.38 | 49.55 | 49.29 | |
| RGCN | 52.17 | 51.57 | 49.62 | 49.24 | 48.20 | 47.61 | |
| Pro-GNN | 52.11 | 50.16 | 50.87 | 45.63 | 46.37 | 47.94 | |
| SA-GNN | 52.73 | 52.65 | 52.58 | 52.48 | 52.40 | 51.05 | |
| 2018 | GCN | 47.16 | 45.24 | 45.08 | 45.22 | 44.79 | 43.61 |
| GAT | 48.20 | 47.62 | 47.46 | 45.44 | 45.85 | 44.41 | |
| RGCN | 48.29 | 47.99 | 47.33 | 45.81 | 45.94 | 45.09 | |
| Pro-GNN | 48.85 | 48.05 | 47.78 | 45.91 | 45.57 | 45.20 | |
| SA-GNN | 49.59 | 49.47 | 48.94 | 47.78 | 47.24 | 46.23 | |
| 2019 | GCN | 55.21 | 53.07 | 51.67 | 50.85 | 49.89 | 49.98 |
| GAT | 57.60 | 54.32 | 53.64 | 52.38 | 51.49 | 50.67 | |
| RGCN | 56.02 | 54.18 | 52.86 | 50.82 | 50.08 | 50.28 | |
| Pro-GNN | 53.83 | 49.45 | 47.74 | 46.59 | 49.11 | 48.65 | |
| SA-GNN | 62.41 | 62.37 | 62.34 | 60.16 | 60.07 | 58.76 |
4.2 Defense Performance
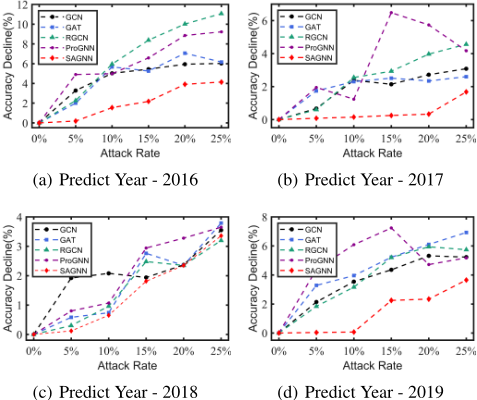
We first evaluate the node classification accuracy of different methods in the face of adversarial attacks on the Bank Dataset. Specifically, we use both feature attack and structure attack to poison the bank data set and predict the credit rating of the bank data set in the next year. We change the perturbation rate-or proportion of attacks-from 0 to 25% in increments of 5%. We repeated these experiments 10 times and reported the average accuracy in Table 1 and the relative accuracy rate in Figure 3.
Our results indicated that under different perturbation rates, our method consistently outperforms other methods, and the average accuracy was also generally less affected by the attack. Specifically, at a 10% perturbation rate on the four-year dataset, the impact of attacks on our model was respectively only 1/3, 1/8, 1/2, and 1/30 compared to GCN. Even under larger perturbations, our method had greater advantages over other baselines. At a 20% perturbation rate on the fouryear dataset, the performance of GCN was very poor, and our model increased GCN by 8%, 5%, 3%, and 10%, respectively. Generally speaking, our model has an excellent performance in both prediction and anti-attack.
4.3 Ablation Study
To better understand how different components help our model resist attacks, we conducted ablative experiments. Our model has two components, namely Selective Representation (SR) and Target Similarity (TS). To explore the impact of each component, we created three model variants for comparison: (w/o) SR, (w/o) TS, and (w/o) SR&TS. For example, (w/o) SR indicates that we removed the SR module while keeping the other modules unchanged. We only evaluated these models for prediction in 2017 and 2019 under 10% and 20% attacks, since similar patterns were observed under other circumstances, as shown in Table 2.
| Year | Method | 10% | 20% |
|---|---|---|---|
| 2017 | SA-GNN (w/o) SR (w/o) TS | 52.58±0.77 52.11±0.41 51.04±0.89 | 52.40±0.41 50.83±0.94 50.90±0.72 |
| (w/o) SR&TS | 51.27±0.55 | 50.91±0.21 | |
| 2019 | SA-GNN (w/o) SR (w/o) TS (w/o) SR&TS | 62.34±0.78 62.27±0.81 61.09±1.08 60.03±0.54 | 60.07±0.70 59.29±0.95 59.41±0.51 |
| 58.93±0.71 |
Our results revealed that the performance of (w/o) SR or (w/o) TS is better than (w/o) SR&TS when the network has 10% or 20% adversarial nodes. Additionally, both of these models slightly under-performed compared to our proposed SA-GNN. Hence, we can conclude that different components have distinct roles in defending against attacks. By merging the components in the proposed SA-GNN model, it can effectively explore the properties of the graph, leading to its superior performance compared to the advanced baselines.
4.4 Parameter Sensitivity Analysis
In this section, we investigated the sensitivity of the super parameter p to SA-GNN, focusing specifically on how changing the value of rate p affects the model's performance in the fouryear dataset experiment with an attack ratio of 20%. More specifically, after changing p from 0 to 0.3, in 0.05 increments respectively, we can observe the resulting changes in the accuracy of SA-GNN.
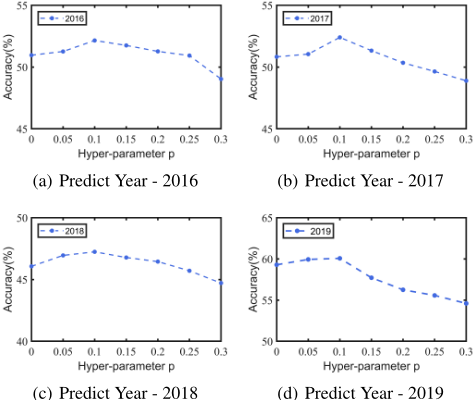
Figure 4 shows that the performance of SA-GNN is not constant. When an optimum value is chosen for p, SA-GNN's accuracy can be improved. However, if the value is too large or too small, it can damage the results, with p being too large in particular posing a particularly serious threat. Our results suggest that the optimal value of p for SA-GNN is around half of the attack ratio.
5 RelatedWorks
5.1 GNN for Credit Rating
Traditional credit rating models have relied on logistic regression algorithms with aggregated financial information, and then turned to machine learning and deep learning methods. [Ioannidis et al., 2010] found that multi-criteria decision support and neural networks had the highest accuracy amongst methods such as multi-criteria decision support, neural network, classification tree, and k-nearest neighbor neural network. [Golbayani et al., 2020b] went on to analyze the performance of four neural network methods-MLP, CNN, CNN2D, and LSTM-in predicting credit ratings.
With the advent of Graph Neural Networks(GNNs), some graph-based models have been widely used in contagion risk and credit ratings[Cheng et al., 2020; Cheng et al., 2021], which have achieved more promising results. For instance, NetRating [Meng et al., 2017] presents a network-based credit rating strategy to measure the credit worthiness, HGAR [Cheng et al., 2019] learns the embedding of guarantee networks by high-order adjacent measures and a graph attention layer, iConViz [Niu et al., 2020] facilitates the closedloop analysis process as interactive visual tool, and iConReg [Cheng et al., 2022] for detecting and isolating of contagion risk. However, these methods do not take into account that individuals may tamper with data in order to improve their own ratings, so they lack the ability to resist attacks.
5.2 Attack and Defense on Graph Neural Network
Research on adversarial attacks on graph neural networks has been scarce until recently, when researchers began to study them in earnest [Sun et al., 2022]. [Z¨ugner et al., 2018] and [Dai et al., 2018] first studied adversarial attacks on neural networks with graph data. Adversarial attacks on these graphs are typically divided into two categories based on the target: feature attacks and structural attacks; and two types based on when they are executed: poisoning attacks and evasion attacks. Poisoning attacks prove particularly challenging to execute, as they usually require difficult bi-level optimization problems, and as such tend to be far less studied. Additionally, compared to structural attacks, feature attacks have been comparatively less explored, as it has been proposed that structural attacks are more destructive [Wu et al., 2019].
Compared to the exploration on attacks, defense methods have yet to be thoroughly studied. Recently, research on strengthening the robustness has begun to emerge, with possible solutions such as graph purification [Wu et al., 2019] proposed to eliminate the links between dissimilar nodes since attackers tend to connect to nodes with distinct properties. [Entezari et al., 2020] recognized that nettack can lead to variations in a high-rank spectrum, recommending preprocessing the graph with low-rank approximations. However, simplistic techniques may prove inadequate when combating complex global attacks. Alternatively, we can focus on learning a robust network. RGCN [Zhu et al., 2019], for example, uses Gaussian distributions as hidden layers for absorbing the effects of adversarial attacks. PA-GNN [Tang et al., 2020] takes advantage of supervision knowledge from clean graphs. ProGNN [Jin et al., 2020] combines the low rank of the graph with both the perturbation graph and GNN parameters.
However, the existing GNN attack and defense models still have limitations when facing our problem. There are few kinds of research on feature attacks, while banks often want to have a good rating, so they may tamper with their bank statements, which is a typical feature attack; The processing of the low rank of a graph usually only considers the structure attack, and it is also difficult to introduce additional clean chart data in the financial network because there is no way to judge that all characteristics of the bank are truthfully reported.
6 Conclusion
In this paper, we present a novel solution to the issue of vulnerable credit rating predictions being attacked, called SAGCN. This model learns clean graphs by building a selective representation layer and exploring the label similarity and the feature similarity. We demonstrate its efficacy by conducting experiments on global bank data, where it outperforms existing state-of-the-art baselines and exhibits improved robustness under attack. These findings open up avenues to predict future credit ratings more accurately, aiding to maintain the safety of the global financial market, thus helping to promote economic growth. Future directions include generalizing this solution to attacking data of other types, as well as considering broader sustainable impacts.
Acknowledgments
This work was supported by the National Natural Science Foundation of China (Grant no. 62102287), the foundation of Key Laboratory of Artificial Intelligence, Ministry of Education, P.R. China and the Shanghai Science and Technology Innovation Action Plan Project (Grant no. 22YS1400600 and 22511100700)
@inproceedings{ijcai2023p675,
  title     = {Preventing Attacks in Interbank Credit Rating with Selective-aware Graph Neural Network},
  author    = {Liu, Junyi and Cheng, Dawei and Jiang, Changjun},
  booktitle = {Proceedings of the Thirty-Second International Joint Conference on
               Artificial Intelligence, {IJCAI-23}},
  publisher = {International Joint Conferences on Artificial Intelligence Organization},
  editor    = {Edith Elkind},
  pages     = {6085--6093},
  year      = {2023},
  month     = {8},
  note      = {AI for Good},
  doi       = {10.24963/ijcai.2023/675},
  url       = {https://doi.org/10.24963/ijcai.2023/675},
}
TY - CPAPER TI - Preventing Attacks in Interbank Credit Rating with Selective-aware Graph Neural Network AU - Liu, Junyi AU - Cheng, Dawei AU - Jiang, Changjun T2 - Proceedings of the Thirty-Second International Joint Conference on Artificial Intelligence, IJCAI-23 PB - International Joint Conferences on Artificial Intelligence Organization PY - 2023 SP - 6085 EP - 6093 DO - 10.24963/ijcai.2023/675 UR - https://doi.org/10.24963/ijcai.2023/675 ER -Copied
Machine-readable versions of this paper, for tools and AI agents:





