
Customized Positional Encoding to Combine Static and Time-varying Data in Robust Representation Learning for Crop Yield Prediction
Proceedings of the Thirty-Second International Joint Conference on Artificial Intelligence. AI for Good. Pages 6094-6102.
https://doi.org/10.24963/ijcai.2023/676
Keywords
- AI for Good: Multidisciplinary Topics and Applications
- AI for Good: Machine Learning
Abstract
Accurate prediction of crop yield under the conditions of climate change is crucial to ensure food security. Transformers have shown remarkable success in modeling sequential data and hold the potential for improving crop yield prediction. To understand how weather and meteorological sequence variables affect crop yield, the positional encoding used in Transformers is typically shared across different sample sequences. We argue that it is necessary and beneficial to differentiate the positional encoding for distinct samples based on time-invariant properties of the sequences. Particularly, the sequence variables influencing crop yield vary according to static variables such as geographical locations. Sample data from southern areas may benefit from more tailored positional encoding different from that for northern areas. We propose a novel transformer based architecture for accurate and robust crop yield prediction, by introducing a Customized Positional Encoding (CPE) that encodes a sequence adaptively according to static information associated with the sequence. Empirical studies demonstrate the effectiveness of the proposed novel architecture and show that partially lin-
earized attention better captures the bias introduced by side information than softmax re-weighting. The resultant crop yield prediction model is robust to climate change, with mean-absolute-error reduced by up to 26% compared to the best baseline model in extreme drought years.
- [Abatzoglou, 2013] John T Abatzoglou. Development of gridded surface meteorological data for ecological appli- cations and modelling. International Journal of Climatol- ogy, 33(1):121-131, 2013.
- [Attia et al., 2021] Ahmed Attia, Salah El-Hendawy, Nasser Al-Suhaibani, Muhammad Usman Tahir, Muhammad Mubushar, Murilo dos Santos Vianna, Hayat Ullah, El- sayed Mansour, and Avishek Datta. Sensitivity of the dssat model in simulating maize yield and soil carbon dynam- ics in arid mediterranean climate: Effect of soil, genotype and crop management. Field crops research, 260:107981, 2021.
- [Boyer et al., 2013] JS Boyer, P Byrne, KG Cassman, M Cooper, D Delmer, T Greene, F Gruis, J Habben, N Hausmann, N Kenny, et al. The us drought of 2012 in perspective: a call to action. Global Food Security, 2(3):139-143, 2013.
- [Cao et al., 2018] Peiyu Cao, Chaoqun Lu, and Zhen Yu. Historical nitrogen fertilizer use in agricultural ecosystems of the contiguous united states during 1850-2015: applica- tion rate, timing, and fertilizer types. Earth System Science Data, 10(2):969-984, 2018.
- [Chu et al., 2021] Xiangxiang Chu, Zhi Tian, Bo Zhang, Xinlong Wang, Xiaolin Wei, Huaxia Xia, and Chunhua Shen. Conditional positional encodings for vision trans- formers. arXiv preprint arXiv:2102.10882, 2021.
- [CSA, 2021] CSA. Agricultural Sample Survey 2020/21 (2013
- E.C). Report on Area and Production of Major Crops, volume I. Statistical Bulletin 590, Central Statis- tical Authority, Addis Ababa, 2021.
- [Dwivedi and Bresson, 2020] Vijay Prakash Dwivedi and Xavier Bresson. A generalization of transformer networks to graphs. arXiv preprint arXiv:2012.09699, 2020.
- [FSIN and GRFC, 2023] FSIN and GRFC. Global report on food crises 2023. https://www.fsinplatform.org/sites/ default/files/resources/files/GRFC2023-hi-res.pdf, 2023. Accessed: 2023-06-05. Link
- [He et al., 2021] Shuting He, Hao Luo, Pichao Wang, Fan Wang, Hao Li, and Wei Jiang. Transreid: Transformer- based object re-identification. In Proceedings of the IEEE/CVF international conference on computer vision, pages 15013-15022, 2021.
- [Hersbach et al., 2018] Hans Hersbach, Bill Bell, Paul Berrisford, Gionata Biavati, András Horányi, Joaquín Muñoz Sabater, Julien Nicolas, Carole Peubey, Raluca Radu, Iryna Rozum, et al. Era5 hourly data on single levels from 1979 to present. Copernicus climate change service (c3s) climate data store (cds), 10(10.24381), 2018.
- [Huang et al., 2020] Zhiheng Huang, Davis Liang, Peng Xu, and Bing Xiang. Improve transformer models with better relative position embeddings. arXiv preprint arXiv:2009.13658, 2020.
- [Jiang et al., 2020] Hao Jiang, Hao Hu, Renhai Zhong, Jin- fan Xu, Jialu Xu, Jingfeng Huang, Shaowen Wang, Yibin Ying, and Tao Lin. A deep learning approach to conflating heterogeneous geospatial data for corn yield estimation: A case study of the us corn belt at the county level. Global change biology, 26(3):1754-1766, 2020.
- [Jin et al., 2019] Cui Jin, Xue Luo, Xiangming Xiao, Jinwei Dong, Xueming Li, Jun Yang, and Deyu Zhao. The 2012 flash drought threatened us midwest agroecosystems. Chi- nese Geographical Science, 29:768-783, 2019.
- [Jones et al., 1986] C Allan Jones, James Robert Kiniry, and PT Dyke. CERES-Maize: A simulation model of maize growth and development. Texas A& M University Press, 1986.
- [Katharopoulos et al., 2020] Angelos Katharopoulos, Apoorv Vyas, Nikolaos Pappas, and Franc ¸ois Fleuret. Transformers are rnns: Fast autoregressive transformers with linear attention. In International Conference on Machine Learning, pages 5156-5165. PMLR, 2020.
- [Ke et al., 2020] Guolin Ke, Di He, and Tie-Yan Liu. Re- thinking positional encoding in language pre-training. arXiv preprint arXiv:2006.15595, 2020.
- [Khaki et al., 2020] Saeed Khaki, Lizhi Wang, and Sotirios V Archontoulis. A cnn-rnn framework for crop yield prediction. Frontiers in Plant Science, 10:1750, 2020.
- [Kreuzer et al., 2021] Devin Kreuzer, Dominique Beaini, Will Hamilton, Vincent Létourneau, and Prudencio Tossou. Rethinking graph transformers with spectral atten- tion. Advances in Neural Information Processing Systems, 34:21618-21629, 2021.
- [Li et al., 2021] Yang Li, Si Si, Gang Li, Cho-Jui Hsieh, and Samy Bengio. Learnable fourier features for multi- dimensional spatial positional encoding. Advances in Neural Information Processing Systems, 34:15816-15829, 2021.
- [Liu et al., 2021] Chang Liu, Xiaoguang Li, Guohao Cai, Zhenhua Dong, Hong Zhu, and Lifeng Shang. Noninva- sive self-attention for side information fusion in sequential recommendation. In Proceedings of the AAAI Conference on Artificial Intelligence, volume 35, pages 4249-4256, 2021.
- [Liu et al., 2022a] Qinqing Liu, Meijian Yang, Koushan Mo- hammadi, Dongjin Song, Jinbo Bi, and Guiling Wang. Machine learning crop yield models based on meteorolog- ical features and comparison with a process-based model. Artificial Intelligence for the Earth Systems, 1(4):e220002, 2022.
- [Liu et al., 2022b] Yuanyuan Liu, Shaoqiang Wang, Jinghua Chen, Bin Chen, Xiaobo Wang, Dongze Hao, and Leigang Sun. Rice yield prediction and model interpretation based on satellite and climatic indicators using a transformer method. Remote Sensing, 14(19):5045, 2022.
- [Luo et al., 2022] Shengjie Luo, Shanda Li, Shuxin Zheng, Tie-Yan Liu, Liwei Wang, and Di He. Your transformer may not be as powerful as you expect. arXiv preprint arXiv:2205.13401, 2022.
- [Qi et al., 2021] Xinyuan Qi, Kai Hou, Tong Liu, Zhongzhong Yu, Sihao Hu, and Wenwu Ou. From known to unknown: Knowledge-guided transformer for time-series sales forecasting in alibaba. arXiv preprint arXiv:2109.08381, 2021.
- [Qin et al., 2022] Zhen Qin, Weixuan Sun, Hui Deng, Dongxu Li, Yunshen Wei, Baohong Lv, Junjie Yan, Ling- peng Kong, and Yiran Zhong. cosformer: Rethinking soft- max in attention. arXiv preprint arXiv:2202.08791, 2022.
- [Raffel et al., 2020] Colin Raffel, Noam Shazeer, Adam Roberts, Katherine Lee, Sharan Narang, Michael Matena, Yanqi Zhou, Wei Li, Peter J Liu, et al. Exploring the limits of transfer learning with a unified text-to-text transformer. J. Mach. Learn. Res., 21(140):1-67, 2020.
- [Raisi et al., 2021] Zobeir Raisi, Mohamed A Naiel, Georges Younes, Steven Wardell, and John Zelek. 2lspe: 2d learnable sinusoidal positional encoding using transformer for scene text recognition. In 2021 18th Conference on Robots and Vision (CRV), pages 119-126. IEEE, 2021.
- [Schnitkey, 2013] Gary Schnitkey. Corn-to-soybean yield ra- tios: History and the future. farmdoc daily, 3(181), 2013.
- [Shang et al., 2021] Chao Shang, Qinqing Liu, Qianqian Tong, Jiangwen Sun, Minghu Song, and Jinbo Bi. Multi- view spectral graph convolution with consistent edge at- tention for molecular modeling. Neurocomputing, 445:12- 25, 2021.
- [Shaw et al., 2018] Peter Shaw, Jakob Uszkoreit, and Ashish Vaswani. Self-attention with relative position representa- tions. arXiv preprint arXiv:1803.02155, 2018.
- [Sun et al., 2019] Jie Sun, Liping Di, Ziheng Sun, Yonglin Shen, and Zulong Lai. County-level soybean yield pre- diction using deep cnn-lstm model. Sensors, 19(20):4363, 2019.
- [Vaswani et al., 2017] Ashish Vaswani, Noam Shazeer, Niki Parmar, Jakob Uszkoreit, Llion Jones, Aidan N Gomez, Łukasz Kaiser, and Illia Polosukhin. Attention is all you need. Advances in neural information processing systems, 30, 2017.
- [Veličković et al., 2017] Petar Veličković, Guillem Cucurull, Arantxa Casanova, Adriana Romero, Pietro Lio, and Yoshua Bengio. Graph attention networks. arXiv preprint arXiv:1710.10903, 2017.
- [Xie et al., 2022] Yueqi Xie, Peilin Zhou, and Sunghun Kim. Decoupled side information fusion for sequential recom- mendation. arXiv preprint arXiv:2204.11046, 2022.
- [Yang et al., 2020] Meijian Yang, Guiling Wang, Kazi Farzan Ahmed, Berihun Adugna, Michael Eggen, Ezana Atsbeha, Liangzhi You, Jawoo Koo, and Em- manouil Anagnostou. The role of climate in the trend and variability of ethiopia's cereal crop yields. Science of The Total Environment, 723:137893, 2020.
- [Yang et al., 2021] Meijian Yang, Guiling Wang, Rehenuma Lazin, Xinyi Shen, and Emmanouil Anagnostou. Impact of planting time soil moisture on cereal crop yield in the upper blue nile basin: A novel insight towards agricul- tural water management. Agricultural Water Management, 243:106430, 2021.
- [Ying et al., 2021] Chengxuan Ying, Tianle Cai, Shengjie Luo, Shuxin Zheng, Guolin Ke, Di He, Yanming Shen, and Tie-Yan Liu. Do transformers really perform badly for graph representation? Advances in Neural Information Processing Systems, 34:28877-28888, 2021.
- [Zhang et al., 2019] Liangliang Zhang, Zhao Zhang, Yuchuan Luo, Juan Cao, and Fulu Tao. Combining optical, fluorescence, thermal satellite, and environmental data to predict county-level maize yield in china using machine learning approaches. Remote Sensing, 12(1):21, 2019.
- [Zhang et al., 2022] Haojie Zhang, Mingfei Liang, Ruobing Xie, Zhenlong Sun, Bo Zhang, and Leyu Lin. Improve transformer pre-training with decoupled directional rela- tive position encoding and representation differentiations. arXiv preprint arXiv:2210.04246, 2022.
- [Zheng et al., 2022] Yanwei Zheng, Zengrui Zhao, Xiaowei Yu, and Dongxiao Yu. Template-aware transformer for person reidentification. Computational Intelligence and Neuroscience, 2022, 2022.
References were extracted automatically from the PDF and may contain errors.
Full text extracted automatically from the PDF; figures, tables and equations may differ. The PDF is the version of record.
1 Introduction
Climate change is anticipated to exacerbate extreme weather events, including heat waves and droughts, which pose significant risks to global food security. To mitigate these effects, it is essential to accurately estimate and predict regional and global crop productivity in response to climate variability, changes, and extremes. Such estimates are crucial for developing agricultural policies, prioritizing international food aid, forecasting and analyzing global trade trends, and identifying effective strategies for climate change adaptation.
Agriculture is the mainstay of Ethiopia's economy, contributing 46% of its gross national product, employing 85% of the population, and accounting for almost all commodity exports [Yang et al., 2021]. Despite this, Ethiopia is among the most severely food-insecure countries in the world. In 2022, approximately 23.6 million people, equivalent to 23.1 % of its total population, were facing high levels of acute food insecurity[FSIN and GRFC, 2023]. Food security remains a significant challenge in Ethiopia. The country's smallholder, rain-fed agriculture system is highly susceptible to climate variability and extremes, exacerbating the vulnerability of its food production system. [Yang et al., 2020]
Crop yield prediction based on seasonal meteorological forcing and soil properties is an effective approach. Machine learning methods have been used to create predictive models [Zhang et al., 2019; Jiang et al., 2020; Sun et al., 2019; Khaki et al., 2020; Liu et al., 2022a]. Recently, Transformers have demonstrated exceptional success for natural language processing and computer vision tasks, and have been tested in crop yield prediction using the Informer model [Liu et al., 2022b]. However, the Informer only considers longitudinal variables, and does not consider non-sequential side information, such as soil and fertilization data. The side information can be critical, as evidenced by the impact of the synthetic fertilizers import ban in May 2021, which caused a 20% drop in rice production in the following 6 months and led to an 80% increase in the rice price in Sri Lanka. Leveraging this type of side information in Transformers should further improve the prediction performance.
Transformer was first introduced for natural language processing where a sentence or a paragraph is decomposed into many tokens (letters, words, passages) that are naturally ordered according to the sentence. Positional encoding (PE) is originally designed as a fixed vector to be added to the embeddings of tokens, and later on, evolves to become learnable parameters. Attention weights are then calculated based on query, key, and value which take into account both token sequences and the positional encoding. Commonly, the positions are one-to-one mapping to order indices and this mapping is shared among different sequences.
The core component in Transformers, the attention mechanism, actually does not distinguish the sequence orders. By calculating the attention value of each pair of tokens, the attention block is able to exchange information between any token pairs. Without the explicit ordering information, researchers can still design the positional encodings for the nodes in a graph, such as the full Laplacian spectrum [Kreuzer et al., 2021]. Those positional encodings are specifically calculated for each graph node, which inject more information and achieve performance improvements.
Although the longitudinal meteorological variables have explicit orders, it remains a question whether the same positional encoding should be used for different samples. The growing periods of crops in different locations are different. From the north to south, the seed and harvest times vary significantly, which could be independent of the meteorological variables in the data. Multiple types of crops could be planted in the same area for different seasons, thus farmers have to follow the specific loop to plant and harvest which is not affected much by weather conditions. Moreover, if two nearby locations have comparable features such as soil and fertilizer, the growing period tends to be similar, which encourages us to predict the yield based on these non-sequential data together with temporal sequences of weather and related variables. Incorporating side information has been proved to be beneficial. For instance, EAGCN [Shang et al., 2021] applies graph edge type as side information and performs better than Graph Attention Network[Veliˇckovi´c et al., 2017] which purely relies on similarity attention between graph nodes in representation learning. In this work, we employ the nonsequential side information to generate the customized positional encoding (CPE) for the sequential data and thus control the information exchange within a sequence differently between different location, soil, or fertilizer conditions.
Our solution is straightforward yet effective. We decouple the positional encoding from the token embedding, and calculate the positional encoding based on non-sequential variables which characterize when and where a meteorological sequence is sampled. 1 This strategy allows the sequences with similar side information to share similar position encodings. Our contributions are summarized as follows:
- A new learnable CPE is designed for the Transformer architecture to make the positional encoding of sequential data dependable on non-sequential side information of different sequences.
- A Partially Linearized Attention Module is proposed to capture the bias from the side information of sequences, which we show better than softmax re-weighting.
- Extensive experiments demonstrate the effectiveness of the proposed novel architecture and the robustness of our approach with respect to climate change.
2 RelatedWork
2.1 Positional Encodings
Shared Positional Encodings in Sequence The original Transformer [Vaswani et al., 2017] either uses a sinusoidal position signal or learns a position embedding for each position and then add that to word embeddings. [Shaw et al., 2018] proposes relative position embeddings to produce a different learned embedding according to the offset between the "key" and "query". Text-to-Text Transfer Transformer (T5) [Raffel et al., 2020] uses a simplified relative position embedding where each embedding is a scalar and added to the corresponding logit used for computing the attention weights. [Huang et al., 2020] proposed a multiplicative relative positional embedding for the logit. Decoupled Directional Relative Position Encoding [Zhang et al., 2022] decouples the relative distance and directional information and maintains them with two different embeddings. TUPE[Ke et al., 2020] decouples the positional encoding from the word embedding and gives a specific design in the attention module to untie the positional encoding for [CLS] symbol. [Luo et al., 2022] proposes a Universal RPE-based (URPE) Attention to guarantee the Transformers using this form of attention are universal approximators of continuous sequence-to-sequence functions. In other domains, the corresponding positional encodings are also developed, according to the property of the input data. For example, [Li et al., 2021][Raisi et al., 2021] proposes the 2D Learnable Sinusoidal Positional Encoding for images, position encoding for both spatial and temporal.
1 Code and data are available at https://github.com/Luckick/CPE
Positional Encoding in Graph and Image [Dwivedi and Bresson, 2020] calculates the eigenvector of the graph Laplacian as positional encoding and adds it to node features. The method also modifies the attention score by multiplying a weight calculated from edge information. Spectral Attention Network (SAN) [Kreuzer et al., 2021] also applies the eigenvectors and their corresponding eigenvalues when supplying information about relative positions in a graph. The Graphormer [Ying et al., 2021] calculates the distance of the shortest path (SPD) between two connected nodes as spatial encoding. [Chu et al., 2021] applies convolution operation to calculate a local environment as conditional positional encodings for image patch.
2.2 Side Information Integration in Transformer
TransReID [He et al., 2021] incorporates the non-visual information, such as cameras or viewpoints, into embedding representations and then calculates summation of this embedding and the input sequence. [Zheng et al., 2022] develops a learnable template for side information and concatenates the template into sequences as extra tokens. NOVA [Liu et al., 2021] designs Non-invasive Self-attention which only applies the sequential side information into the attention calculation but not the value matrix in the Transformer heads. AliFormer [Qi et al., 2021] merges the attention from other sequences which could include future information to help with the prediction of the main sequence. DIF-SIR [Xie et al., 2022] follows a similar concept while proves that the merged attention matrix has a higher rank and could be more informative.
2.3 Crop Yield Prediction
Agricultural scientists [Jones et al., 1986][Attia et al., 2021] have developed a Process-Based Model which takes meteorological variables (e.g., air temperature and humidity, precipitation, and solar radiation) and soil properties as inputs. They parameterize crop physiological and phenological processes, and entail a large number of cultivar-specific parameters that have to be calibrated based on field experiments. [Yang et al., 2020] [Zhang et al., 2019] and [Jiang et al., 2020] integrate multiple sources of data such as meteorological forcing, soil properties, irrigation information and cumulative exposure metrics, to train Random Forest (RF), Gradient Boosting (XGBoost), long short-termmemonry (LSTM), least absolute shrinkage and selection operator (LASSO) or Convolutional Neural Network (CNN) model for maize yield in China and the U.S. Corn Belt. [Sun et al., 2019] and [Khaki et al., 2020] include both CNN and LSTM in a framework where CNN is used to process spatial features and weather components while LSTM is used to capture the time dependencies. [Liu et al., 2022a] proposes attention-based LSTMmodel that calculates the attention of each time point based on side information and provides a shortcut to aggregate the hidden states of all time points when making prediction. [Liu et al., 2022b] is the first to use Transformer to process the sequences.
3 The Proposed CPEMethod
In this section, we first briefly review the structure and different components of Transformer, and then describe how our CPE method integrates non-sequential side information into the positional encoding of Transformer to improve sequence regression performance and robustness.
We solve a regression problem where each data point consists of a set of sequences and a side information vector s. The sequence data X contains the time series of d features as columns (x1, x2, ..., xN)T where N is the total number of time steps and each xi contains d features. The label associated with each record is a scalar.
3.1 AttentionModule
The attention module [Vaswani et al., 2017] is formulated as querying a dictionary with key-value pairs, e.g.,
where Q (Query), K (Key), V (Value) are specified as the hidden representations: Q = (X + P)W Q, K = (X + P)W K , V = (X + P)W V where X is the sequence embedding, P is positional encoding which could be either calculated from sine/cosine function or set as learnable parameters with the same size of X, W Q,W K , and W V are learnable parameters. We refer the QKT as score matrix and apply a softmax re-weighting to get the attention matrix softmax(QKT ). The multi-head variant of the attention module is popularly used and allows the model to jointly attend to the information from different representation sub-spaces, and is defined as Multi - Head(Q,K, V ) = Concat(head1, head2, ..., headM) where headm = Attention(X′W Q m , X′W K m ,X′W Vm ) and X′ =X +P.
Following the TUPE [Ke et al., 2020] method 2 which questions the rationality of the linear arithmetic between the word embedding and the positional embedding, the positional correlation and word correlation are computed separately.
The score matrix becomes the sum of word embedding score matrix and positional embedding score matrix.
where α is the score matrix, xi, xj are the embedding of the sequence at indices i and j respectively, pi, pj are the corresponding positional encoding, U Q and U K are the learnable parameters for the query and key counterparts in the positional encoding.
3.2 Customized Positional Encoding
In contrast to the conventional positional encoding which, as previously discussed, is shared across various sequences, our CPE aims to re-calibrate the positional encoding in a manner that reflects the unique side characteristics intrinsic to its associated sequence, thereby moving away from a universal, one-size-fits-all encoding scheme. Essentially, the CPE should be a function of side information s, which can be formulated as
In such a way, the CPE possesses the potential capability to distinguish periods within a sequence, using the static information as a guide. Consequently, sequences with varying side information exhibit unique patterns, thereby promoting the model's ability to capture these differentiated patterns.
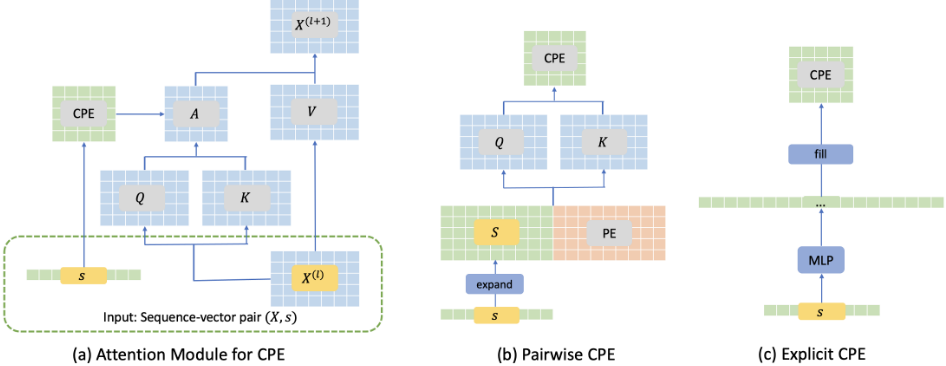
Generally, we have two categories of methods that encode the customized positional information in the attention module, pairwise CPE and explicit CPE, depicted in Fig. 1. We also show that the CPE concept could be generalized to sequential side information in Supplemental Material Sec. 1.
Pairwise Customized Positional Encoding
This approach aims to model the relationships between a pair of input features or positions by utilizing different projection matrices U Q and U K . It involves integrating the side information s with the shared positional encoding pi into a function g, as opposed to relying solely on pi, and we have
Given that pi and pj could be generated from the sine/cosine functions for sequences of arbitrary length, the pairwise CPE is also able to handle the sequences of varying length. In our implementation, as demonstrated in Fig. 1(b), g(·) is a multi-layer perceptron (MLP) that takes the concatenation of pi and s as input and generates a vector. This vector is used to calculate the key or query representation to further form our CPE matrix, similar to (2).
Explicit Customized Positional Encoding
This approach does not incorporate any prior knowledge of positional encoding; rather, it solely relies on the side information, and in other words, calculating the CPE matrix as a function h(s). The dimensionality of the output produced by h(s) could either be N ∗ N, which symbolizes absolute positional encoding of the sequence, or 2N-1 in accordance with the Directional Relative Position Encoding paradigm [Zhang et al., 2022]. Our approach also supports specialized designs, such as untying the special tokens from positions [Ke et al.,
2020], by filling in the CPE matrix according to a given setting.
where τ is an indexing function to extract specific indexed elements from the vector h(s) and use them to fill CPEexp .
In our implementation, shown in Fig. 1(c), we take the absolute positional encoding that transforms s into a vector h(s) of size N ∗ N and then fill each element to a position of a CPE matrix with size (N, N). The absolute CPE can be looked up from vector h(s) with τ(i, j) = i ∗ N + j , such that CPEabs (i,j) = h(s)[i ∗ N + j].
3.3 Partially Linearized AttentionModule
As introduced in Section 3.1, the vanilla version of attention module employs a softmax function to transform the score matrix and obtain row-wise normalization to yield probability values. Empirically, the softmax attention tends to get better performance by punishing far-away connections and enforcing locality in some cases [Qin et al., 2022]. The Linearized Attention was first proposed in [Katharopoulos et al., 2020] to reduce the complexity and to accelerate the inference. We generalize the linear attention to use any similarity measure derived from a kernel function. In other words, we utilize a kernel function as innter product of mapped features ϕ(x) and rewrite the attention matrix in a vectorized form as follows:
While using the softmax function is beneficial for sequence modeling, mitigating the issue of gradient explosion, it potentially undermines the bias introduced by side information, as softmax normalizes its input into probabilities.
Hence, we propose a Partially Linearized Attention Module (PLAM) that applies the softmax function to the attention score derived from the sequence embedding, while retaining a linear/identical function for the CPE. We combine the score matrix and CPE additively, and use the resulting matrix as the attention matrix in the corresponding head of the Attention Module.
By avoiding softmax on CPE, the influence on token interactions is more explicit and straightforward, making it less affected by the actual sequence data. While the linearized attention was invented to reduce the computational complexity at a cost of a small sacrifice in the performance, our experiments further indicate that it could help maintain the bias introduced by the side information and give more accurate prediction. We will justify the benefits of the PLAM through comparative analysis in Section 4.4.
Case Study: Attention-based Residual Block
We argue that the Attention-based Residual Block in LSTMatt [Liu et al., 2022a], aggregating hidden states at each time step, can be seen as a special case of our PLAM. By employing a single head, injecting λ1 = 0 and λ2 = 1 in (7), and treating W V as an identity matrix such that V = XW V = X, the output of PLAM becomes CPE ×X, so we have the embedding of the first token as ∑nj=1 h(s)[j]∗xj for the regression task. This aligns well with the the attention mechanism in LSTMatt wherein the final state is a weighted sum of all hidden states, aggregated through attention values derived from static side information.
3.4 Overall Structure
Based on the aforementioned basic modules, we construct our CPE network following the structural design of a Transformer encoder. We utilize a fully connected layer to combine the outputs from the multi-head attention (MHA) module and merge them with MHA inputs via a skip connection. Similar to vanilla Transformer, we extract the first token's embedding, which encapsulates learning from the input sequence and its side information, and then employ a fully connected layer for final prediction.
| Dataset | Size | Day | County | Year | MF | SF |
| Maize | 20,259 | 210 | 1,413 | 2000-2018 | 19 | 97 |
|---|---|---|---|---|---|---|
| Soybean | 25,171 | 210 | 717 | 1979-2018 | 19 | 95 |
| Ethiopia | 7,951 | 154 | 563 | 2004-2021 | 26 | 106 |
4 Experiments
In this section, we first evaluate the overall performance of the proposed CPE on three real-world agriculture datasets. We then analyze the robustness of our model under extreme weather conditions. Finally, we demonstrate the effectiveness of decoupling side information from the sequence data.
4.1 Datasets
In our experiments, we utilize three real-world datasets from various locations, including one from Ethiopia and two from the United States. Each dataset is assembled by collecting and merging data from multiple sources. We first present the statistical summary of the pre-processed datasets, which serve as the input to the proposed Transformer model. The content and characteristics of the features are further described.
Table 1 provides an overview of the key characteristics of each data, including the sample size (Size), the number of days for which a meteorological forcing feature was captured (Day), counties or regions (County), recorded years (Year), meteorological forcing features measured in each day (MF), and static side information features (SF) in each dataset.
In the Maize and Soybean datasets, crop yield data is obtained from the USDA National Agricultural Statistics Service (NASS) website https://www.nass.usda.gov for counties located in the US Cornbelt. The surface meteorological variables are extracted from the gridMET dataset[Abatzoglou, 2013], which includes information on temperature, humidity, radiation, moisture, wind, precipitation, solar radiation, and evapotranspiration. For the data from Ethiopia, the crop (maize) production data was sourced from the Central Statistics Authority (CSA) [CSA, 2021], spanning from 2004 to
2021, and was obtained through interviews and measurements conducted on over 45,000 households across the rural regions of the county. Additionally, climate and environmental variables, such as wind speed, temperature, dewpoint temperature, surface pressure, precipitation, soil temperature and soil water at 4 layers, were acquired from the European Centre for Medium-Range Weather Forecasts (ECMWF) Reanalysis v5 (ERA5) dataset [Hersbach et al., 2018]. The side information utilized in this study comprises geographical features (e.g. latitude, longitude, area), year information, fertilization usage, and static soil features [Cao et al., 2018] (e.g. soil texture, bulk density, etc.).
The meteorological forcing and soil data were originally sourced at grid-level. We aggregate the grid-level feature values into county level by computing the mean value of all grids within each county. Given that the study area spans a widerange of latitudes that exhibit variations in the start date and duration of the growing season, our models are configured to utilize the 154-day ERA5 and 210-day gridMET data of each year, covering the period from May 1st to October 1st in Ethiopia, and April 10th to November 6th for Maize/Soybean, respectively.
4.2 Set-up
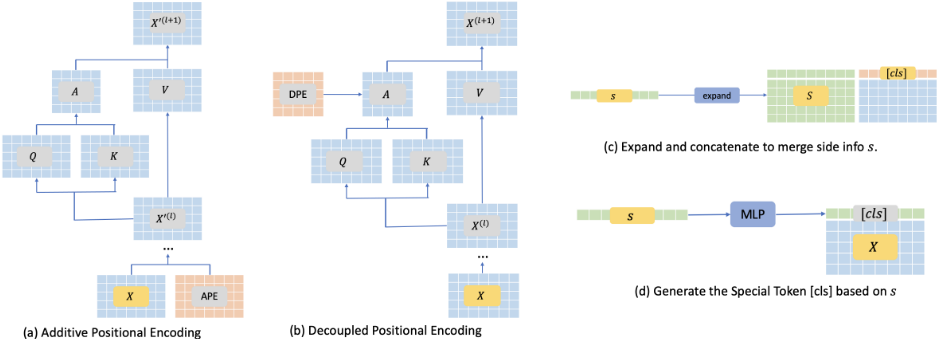
Baseline: We test the proposed method against seven baseline methods. TF(No-Side) employs vanilla Transformer and operates solely on sequential data without incorporating with any side information. The other baselines include traditional forecasting methods such as Random Forest (RF) and XGBoost, advanced Long Short-Term Memory with Attentionbased Residual Block (LSTM-Att), and Transformer-based (TF) methods for both sequential and static features. These transformers can be categorized into vanilla Additive Positional Encodings (APE) and Decoupled Positional Encodings (DPE), based on the approach to adding positional encodings. We also examine different techniques for aggregating the static features into the transformer architecture, including Expanding and Concatenating (EC), or generating a Special Token (ST). We show the differences between APE and DPE, as well as EC and ST in Fig. 2.
CPE: We propose several variants of CPE including CPEP for pairwise CPE, CPE-Abs for absolute CPE, and CPEAtt with an additional layer the same as discussed in the Attention-based Residual Block case study.
Train/Test Split: Similar to k-fold cross validation, we adopt a leave-one-year-out approach for our study. It involves looping through each year and using it as the test set with all other years for training. For the Corn and Ethiopia dataset, we test the methods on every year. On Soybean, we only leave year 2000-2018 as test considering the data quality.
Evaluation Metrics: All methods are evaluated in terms of four metrics: mean absolute error (MAE), root mean square error (RMSE), correlation coefficient (r), and coefficient of determination (R2 ).
Additional implementation details can be found in the Supplemental Material Sec. 2.
4.3 Experimental Results
Overall Forecasting Quality
We first evaluate the performance of CPE by comparing it with all the aforementioned baselines. As shown in Table 2, we collect the records from all testing years and calculate the evaluation metrics. Primarily, integrating static side information into the model evidently improves the prediction performance. The proposed CPE outperforms the best baseline model. CPE-P does not perform well in this study as it benefits from sequences of different lengths by calculating CPE implicitly. However, in our study datasets, the length of all sequences is fixed and the growing stage is deterministic, which allows the absolute variant performs better.
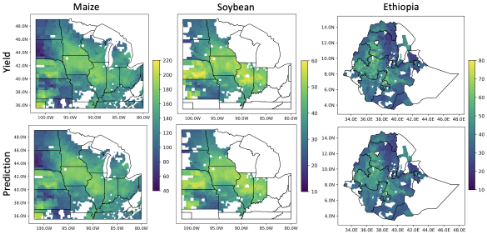
Fig. 3 presents the mean yield and prediction for all testing years, and provides several observations. First, our model demonstrates an ability to capture the inductive bias from each county, as evidenced by the close alignment of prediction values with corresponding yield value. Second, all of the models employed in this study exhibit poor performance in predicting the maize yield in Ethiopia. This can be attributed to the dramatically increasing yield trend in the region, while all models primarily focus on capturing a linear growing trend, as depicted in Fig. 4.
Robustness in Years with Extreme Weather Conditions
In Fig. 4, we present the MAE and R2 metrics for all pre-
dicted years. Notably, the year 2012 was marked by an extreme drought [Boyer et al., 2013][Jin et al., 2019], which posed a significant challenge for all models to achieve accurate predictions. Nonetheless, our method performs relatively better in this year than the other models. Furthermore, while all models fail to take into account the impact of the aphid, other disease, and pest issues that led to the low soybean yields in 2003 [Schnitkey, 2013], our method still outperforms other models. Specifically, the model created by our method is able to capture the moderate drought that occurred in 2003 and contributed to a yield drop.
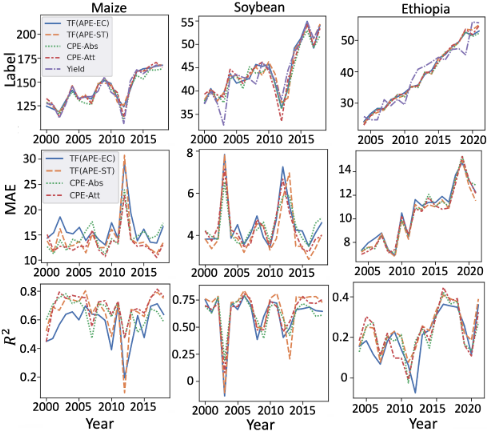
Comparing the proposed CPE method to the baseline models, we found that the baseline with special token has a good overall prediction performance but is not robust in extreme weather conditions. In contrast, the proposed CPE has smallest spike, and can make precise predictions even under extreme weather conditions. The baseline APE-ST which achieves the best overall performance is fragile during extreme weather and can not make accurate predictions. Quantitatively, our model has reduced the MAE by up to 26% (22.76 vs 30.77 in 2012) and 17% (6.53 vs 7.79 in 2003) respectively for Corn and Soybean, in those years with extreme weather conditions. Interestingly, we do not observe spikes in Ethiopia probably due to the overwhelmingly increasing trend in yield, which makes the drop less noticeable.
Robustness is crucial and even more important than the overall forecasting quality, as a huge decrease in production can drastically inflate crop prices and threaten food security. For instance, a 20% decrease in yield in Sri Lanka has led to an 80% increase in prices. Robust predictions under conditions of extreme weather can help develop effective agricultural policies and prioritize international food aid to prevent people from hunger and poverty due to production decreases.
Ability to Capture Inductive Bias from Side Information
As previously mentioned, the inclusion of side information can have great impact on yield prediction. These important features on soil quality, fertilizer usage and other hidden variables, such as management ability and technical expertise, are not reflected in the input features. These factors can result in significant variations in the yield across counties, even in the presence of similar meteorological forcing features. The experiments, as depicted in Table 2 and Fig. 5, show that the incorporation of side information greatly enhances the prediction performance.
| Maize | Soybean | Ethiopia | ||||||||||
|---|---|---|---|---|---|---|---|---|---|---|---|---|
| Model | r | R2 | RMSE | MAE | r | R2 | RMSE | MAE | r | R2 | RMSE | MAE |
| TF(No-Side) | 0.45 | 0.27 | 31.21 | 24.42 | 0.72 | 0.48 | 8.03 | 6.17 | 0.35 | 0.11 | 17.12 | 13.61 |
| RF | 0.70 | 0.46 | 26.79 | 20.91 | 0.70 | 0.35 | 8.95 | 7.27 | 0.56 | 0.27 | 15.46 | 12.40 |
| XGBoost | 0.78 | 0.60 | 23.03 | 17.40 | 0.76 | 0.55 | 7.46 | 5.78 | 0.67 | 0.41 | 13.91 | 10.51 |
| LSTM-Att | 0.85 | 0.73 | 18.96 | 14.14 | 0.86 | 0.74 | 5.64 | 4.35 | 0.67 | 0.44 | 13.59 | 10.48 |
| TF(APE-EC) | 0.81 | 0.66 | 21.27 | 16.12 | 0.85 | 0.72 | 5.93 | 4.52 | 0.66 | 0.44 | 13.63 | 10.53 |
| TF(APE-ST) | 0.85 | 0.72 | 19.16 | 14.30 | 0.87 | 0.75 | 5.52 | 4.19 | 0.68 | 0.47 | 13.27 | 10.21 |
| TF(DPE-EC) | 0.82 | 0.66 | 21.13 | 16.12 | 0.85 | 0.72 | 5.85 | 4.43 | 0.67 | 0.44 | 13.58 | 10.45 |
| TF(DPE-ST) | 0.85 | 0.72 | 19.29 | 14.34 | 0.86 | 0.74 | 5.66 | 4.27 | 0.68 | 0.46 | 13.37 | 10.33 |
| CPE-P | 0.79 | 0.62 | 22.53 | 17.20 | 0.85 | 0.73 | 5.77 | 4.42 | 0.66 | 0.44 | 13.62 | 10.54 |
| CPE-Abs | 0.85 | 0.73 | 18.98 | 14.52 | 0.86 | 0.75 | 5.60 | 4.32 | 0.67 | 0.45 | 13.52 | 10.40 |
| CPE-Att | 0.88 | 0.77 | 17.48 | 13.39 | 0.86 | 0.74 | 5.69 | 4.36 | 0.68 | 0.45 | 13.51 | 10.31 |
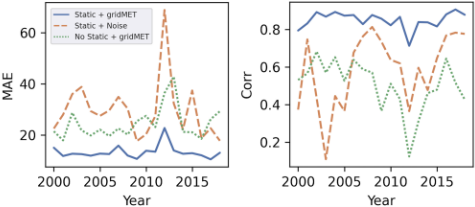
To investigate this further, we conduct an experiment on the Maize dataset, where a Gaussian noise (mean: 0, standard deviation: 1) is applied to replace the meteorological forcing input for all counties, shown in Fig. 5. By decoupling the side information from the sequence embedding and using Partially Linearized Attention Module to avoid re-weighting by softmax normalization, our model is able to learn a relatively fixed CPE for sequence data sampled from the same county, and focus more on the changes in the meteorological forcing. As a result, the model is more sensitive to the changes due to the meteorological forcing, thus enabling the prediction from the abnormalities. The side information with noise does not perform well on the years with drought weather such as 2003 and 2012. However, using the gridMET meteorological forcing as input, we can capture the abnormality information within the gridMET and produce relative good performance. Fig. 5 also indicates the side information captures better inductive bias than sequential information alone as it has a higher correlation in most of the years.
We conduct an ablation study where the PLAM demonstrates superior performance, and consistently outperforms the softmax based networks, as shown in Table 3.
| Dataset | Method | r | R2 | RMSE | MAE |
| Maize | Softmax | 0.84 | 0.70 | 20.03 | 15.19 |
|---|---|---|---|---|---|
| PL | 0.85 | 0.73 | 18.98 | 14.52 | |
| Soybean | Softmax | 0.84 | 0.70 | 6.05 | 4.59 |
| PL | 0.86 | 0.75 | 5.60 | 4.32 | |
| Ethiopia | Softmax | 0.63 | 0.39 | 14.20 | 10.95 |
| PL | 0.67 | 0.45 | 13.52 | 10.40 |
5 Conclusion and Discussion
In this study, we introduce a new CPE to crop yield modeling that incorporates meteorological forcing and soil information, and apply it to the U.S. Corn Belt (for maize and soybean) and Ethiopia (for maize). CPE is found to outperform several other approaches in capturing the spatiotemporal variability of crop yield in both countries.
The performance of our model varies between regions, being notably better in the U.S. Corn Belt than in Ethiopia. In the U.S., weather is the primary cause for the inter-annual and spatial variability of crop yield, due to better seed quality, technology advancement, and resource availability; in Ethiopia however, factors such as labor availability and labor input, seed quality, fertilizer affordability can vary dramatically from year to year, which influence crop yield variability but are not reflected by input data. For this reason, weather is not the primary cause for crop yield in Ethiopia.
Another distinct feature is that crop yield has experienced a stronger increasing trend in Ethiopia than in the U.S.. Crop yield in Africa is much lower than the rest of the world due to the low rate of irrigation and low agricultural input, among others. More recently, the adoption of technology, better seed, and expansion of irrigated land have caused rapid increase of yield. These non-environmental factors play a major role in influencing the trend and variability of yield in Ethiopia, making the training of models more challenging.
@inproceedings{ijcai2023p676,
  title     = {Customized Positional Encoding to Combine Static and Time-varying Data in Robust Representation Learning for Crop Yield Prediction},
  author    = {Liu, Qinqing and Dou, Fei and Yang, Meijian and Amdework, Ezana and Wang, Guiling and Bi, Jinbo},
  booktitle = {Proceedings of the Thirty-Second International Joint Conference on
               Artificial Intelligence, {IJCAI-23}},
  publisher = {International Joint Conferences on Artificial Intelligence Organization},
  editor    = {Edith Elkind},
  pages     = {6094--6102},
  year      = {2023},
  month     = {8},
  note      = {AI for Good},
  doi       = {10.24963/ijcai.2023/676},
  url       = {https://doi.org/10.24963/ijcai.2023/676},
}
TY - CPAPER TI - Customized Positional Encoding to Combine Static and Time-varying Data in Robust Representation Learning for Crop Yield Prediction AU - Liu, Qinqing AU - Dou, Fei AU - Yang, Meijian AU - Amdework, Ezana AU - Wang, Guiling AU - Bi, Jinbo T2 - Proceedings of the Thirty-Second International Joint Conference on Artificial Intelligence, IJCAI-23 PB - International Joint Conferences on Artificial Intelligence Organization PY - 2023 SP - 6094 EP - 6102 DO - 10.24963/ijcai.2023/676 UR - https://doi.org/10.24963/ijcai.2023/676 ER -Copied
Machine-readable versions of this paper, for tools and AI agents:





