
Benchmarking eXplainable AI - A Survey on Available Toolkits and Open Challenges
Proceedings of the Thirty-Second International Joint Conference on Artificial Intelligence. Survey Track. Pages 6665-6673.
https://doi.org/10.24963/ijcai.2023/747
Keywords
- Survey: Humans and AI
- Survey: AI Ethics, Trust, Fairness
- Survey: Machine Learning
Abstract
The goal of Explainable AI (XAI) is to make the reasoning of a machine learning model accessible to humans, such that users of an AI system can evaluate and judge the underlying model. Due to the blackbox nature of XAI methods it is, however, hard to disentangle the contribution of a model and the explanation method to the final output. It might be unclear on whether an unexpected output is caused by the model or the explanation method. Explanation models, therefore, need to be evaluated in technical (e.g. fidelity to the model) and user-facing (correspondence to domain knowledge) terms. A recent survey has identified 29 different automated approaches to quantitatively evaluate explanations. In this work, we take an additional perspective and analyse which toolkits and data sets are available. We investigate which evaluation metrics are implemented in the toolkits and whether they produce the same results. We find that only a few aspects of explanation quality are currently covered, data sets are rare and evaluation results are not comparable across different toolkits. Our survey can serve as a guide for the XAI community for identifying future directions of research, and most notably, standardisation of evaluation.
- [Adadi and Berrada, 2018] Amina Adadi and Mohammed Berrada. Peeking Inside the Black-Box: A Survey on Explainable Artificial Intelligence (XAI). IEEE Access, 6:52138-52160, 2018.
- [Agarwal et al., 2021] Chirag Agarwal, Himabindu Lakkaraju, and Marinka Zitnik. Towards a unified framework for fair and stable graph representation learning. In Uncertainty in Artificial Intelligence, pages 2114-2124. PMLR, 2021.
- [Agarwal et al., 2022a] Chirag Agarwal, Satyapriya Kr- ishna, Eshika Saxena, Martin Pawelczyk, Nari Johnson, Isha Puri, Marinka Zitnik, and Himabindu Lakkaraju. Openxai: Towards a transparent evaluation of model ex- planations. In Thirty-sixth Conference on Neural Informa- tion Processing Systems Datasets and Benchmarks Track, 2022.
- [Agarwal et al., 2022b] Chirag Agarwal, Owen Queen, Himabindu Lakkaraju, and Marinka Zitnik. Eval- uating explainability for graph neural networks. https://arxiv.org/abs/2208.09339, 2022. Link
- [Arya et al., 2020] Vijay Arya, Rachel K. E. Bellamy, Pin- Yu Chen, Amit Dhurandhar, Michael Hind, Samuel C. Hoffman, Stephanie Houde, Q. Vera Liao, Ronny Luss, Aleksandra Mojsilovi, Sami Mourad, Pablo Pedemonte, Ramya Raghavendra, John T. Richards, Prasanna Sattigeri, Karthikeyan Shanmugam, Moninder Singh, Kush R. Varshney, Dennis Wei, and Yunfeng Zhang. Ai explain- ability 360: An extensible toolkit for understanding data and machine learning models. Journal of Machine Learn- ing Research, 21(130):1-6, 2020.
- [Baehrens et al., 2010] David Baehrens, Timon Schroeter, Stefan Harmeling, Motoaki Kawanabe, Katja Hansen, and Klaus-Robert Müller. How to explain individual classifi- cation decisions. The Journal of Machine Learning Re- search, 11:1803-1831, 2010.
- [Barredo Arrieta et al., 2020] Alejandro Barredo Arrieta, Natalia Díaz-Rodríguez, Javier Del Ser, Adrien Bennetot, Siham Tabik, Alberto Barbado, Salvador Garcia, Sergio Gil-Lopez, Daniel Molina, Richard Benjamins, Raja Chatila, and Francisco Herrera. Explainable Artificial Intelligence (XAI): Concepts, taxonomies, opportunities and challenges toward responsible AI. Information Fusion, June 2020.
- [Belaid et al., 2022] Mohamed Karim Belaid, Eyke Hüllermeier, Maximilian Rabus, and Ralf Krestel. Do We Need Another Explainable AI Method? To- ward Unifying Post-hoc XAI Evaluation Methods into an Interactive and Multi-dimensional Benchmark. https://arxiv.org/abs/2207.14160, 2022. Link
- [Carmichael and Scheirer, 2021] Zachariah Carmichael and Walter J. Scheirer. A framework for evaluating post hoc feature-additive explainers. https://arxiv.org/abs/2106. 08376, 2021. Link
- [Chattopadhyay et al., 2019] Aditya Chattopadhyay, Anir- ban Sarkar, Prantik Howlader, and Vineeth N. Balasubra- manian. Grad-cam++: Generalized gradient-based visual explanations for deep convolutional networks. In IEEE Winter Conf. on Applications of Computer Vision, 2019.
- [Cui et al., 2022] Yiming Cui, Ting Liu, Wanxiang Che, Zhi- gang Chen, and Shijin Wang. ExpMRC: explainability evaluation for machine reading comprehension. Heliyon, 8(4), Apr 2022.
- [DARPA, 2016] DARPA. Explainable artificial intelligence (xai) programm. Technical report, 2016.
- [Doshi-Velez and Kim, 2018] Finale Doshi-Velez and Been Kim. Considerations for Evaluation and Generalization in Interpretable Machine Learning, pages 3-17. Springer International Publishing, Cham, 2018.
- [Dua and Graff, 2017] Dheeru Dua and Casey Graff. Uci machine learning repository. http://archive.ics.uci.edu/ml/ index.php, 2017. Accessed: 2022-12-01. Link
- [Freshcorn, 2022] Bryce Freshcorn. Give me some credit :: 2011 competition data -kaggle. https://www.kaggle. com/datasets/brycecf/give-me-some-credit-dataset, 2022. Accessed: 2022-12-01. Link
- [Gilpin et al., 2018] Leilani H. Gilpin, David Bau, Ben Z. Yuan, Ayesha Bajwa, Michael Specter, and Lalana Kagal. Explaining explanations: An overview of interpretability of machine learning. In DSAA, pages 80-89. IEEE, 2018.
- [Graziani et al., 2021] Mara Graziani, Thomas Lompech, Henning Müller, and Vincent Andrearczyk. Evaluation and comparison of cnn visual explanations for histopathol- ogy. In Proceedings of the AAAI Conference on Artificial Intelligence Workshops (XAI-AAAI-21), February 2021.
- [Guidotti et al., 2018] Riccardo Guidotti, Anna Monreale, Salvatore Ruggieri, Franco Turini, Fosca Giannotti, and Dino Pedreschi. A Survey of Methods for Explaining Black Box Models. ACM Computing Surveys, 51(5):93:1- 93:42, August 2018.
- [Hameed et al., 2022] Isha Hameed, Samuel Sharpe, Daniel Barcklow, Justin Au-Yeung, Sahil Verma, Jocelyn Huang, Brian Barr, and C. Bayan Bruss. BASED-XAI: Breaking Ablation Studies Down for Explainable Artificial Intelli- gence. In KDD Workshop on Machine Learning for Fi- nance, 2022.
- [Hedström et al., 2022] Anna Hedström, Leander Weber, Dilyara Bareeva, Franz Motzkus, Wojciech Samek, Se- bastian Lapuschkin, and Marina M. C. Höhne. Quantus: An Explainable AI Toolkit for Responsible Evaluation of Neural Network Explanations. https://arxiv.org/abs/2202. 06861, 2022. Link
- [Holter et al., 2018] Steffen Holter, Oscar Gomez, and Enrico Bertini. Fico explainable machine learning challenge. https://community.fico.com/s/ explainable-machine-learning-challenge, 2018. Ac- cessed: 2022-12-01. Link
- [Hoofnagle et al., 2019] Chris Jay Hoofnagle, Bart van der Sloot, and Frederik Zuiderveen Borgesius. The european union general data protection regulation: what it is and what it means. Information & Communications Technol- ogy Law, 28(1):65-98, 2019.
- [Huang et al., 2022] Wei Huang, Xingyu Zhao, Gaojie Jin, and Xiaowei Huang. Safari: Versatile and efficient eval- uations for robustness of interpretability. https://arxiv.org/ abs/2208.09418, 2022. Link
- [Karunagaran et al., 2022] Surya Karunagaran, Ana Lucic, and Christine Custis. Xai toolsheet: Towards a documenta- tion framework for xai tools. In Workshop on Explainable Artificial Intelligence (XAI), IJCAI, 2022.
- [Kokhlikyan et al., 2020] Narine Kokhlikyan, Vivek Miglani, Miguel Martin, Edward Wang, Bilal Al- sallakh, Jonathan Reynolds, Alexander Melnikov, Natalia Kliushkina, Carlos Araya, Siqi Yan, and Orion Reblitz-Richardson. Captum: A unified and generic model interpretability library for PyTorch. https://arxiv.org/abs/2009.07896, 2020. Link
- [Li et al., 2022] Xuhong Li, Haoyi Xiong, Xingjian Li, Xu- anyu Wu, Zeyu Chen, and Dejing Dou. Interpretdl: Ex- plaining deep models in paddlepaddle. Journal of Machine Learning Research, 23(197):1-6, 2022.
- [Lin et al., 2021] Yi-Shan Lin, Wen-Chuan Lee, and Z. Berkay Celik. What Do You See? Evaluation of Explainable Artificial Intelligence (XAI) Interpretability through Neural Backdoors. In Proceedings of the 27th ACM SIGKDD Conference on Knowledge Discovery & Data Mining, KDD '21, page 1027-1035, New York, NY, USA, 2021. Association for Computing Machinery.
- [Liu et al., 2021] Yang Liu, Sujay Khandagale, Sujay Khandagale, Colin White, and Willie Neiswanger. Syn- thetic Benchmarks for Scientific Research in Explainable Machine Learning. In J. Vanschoren and S. Yeung, editors, Proceedings of the Neural Information Processing Systems Track on Datasets and Benchmarks, volume 1, 2021.
- [Lopes et al., 2022] Pedro Lopes, Eduardo Silva, Cristiana Braga, Tiago Oliveira, and Luís Rosado. Xai systems eval- uation: A review of human and computer-centred meth- ods. Applied Sciences, 12(19), 2022.
- [Lundberg and Lee, 2017] Scott M Lundberg and Su-In Lee. A unified approach to interpreting model predictions. In I. Guyon, U. Von Luxburg, S. Bengio, H. Wallach, R. Fer- gus, S. Vishwanathan, and R. Garnett, editors, Advances in Neural Information Processing Systems, volume 30. Cur- ran Associates, Inc., 2017.
- [Mitchell et al., 2019] Margaret Mitchell, Simone Wu, An- drew Zaldivar, Parker Barnes, Lucy Vasserman, Ben Hutchinson, Elena Spitzer, Inioluwa Deborah Raji, and Timnit Gebru. Model cards for model reporting. In Pro- ceedings of the Conference on Fairness, Accountability, and Transparency, FAT* '19, page 220-229, New York, NY, USA, 2019. Association for Computing Machinery.
- [Mohseni et al., 2021] Sina Mohseni, Niloofar Zarei, and Eric D. Ragan. A multidisciplinary survey and framework for design and evaluation of explainable ai systems. ACM Trans. Interact. Intell. Syst., 11(3-4), sep 2021.
- [Nauta et al., 2023] Meike Nauta, Jan Trienes, Shreyasi Pathak, Elisa Nguyen, Michelle Peters, Yasmin Schmitt, Jörg Schlötterer, Maurice van Keulen, and Christin Seifert. From Anecdotal Evidence to Quantitative Evaluation Methods: A Systematic Review on Evaluating Explain- able AI. ACM Comput. Surv., 2023.
- [Ngai and Rudzicz, 2022] Hillary Ngai and Frank Rudzicz. Doctor xavier: Explainable diagnosis on physician-patient dialogues and xai evaluation. https://arxiv.org/abs/2204. 10178, 2022. Link
- [Ribeiro et al., 2016] Marco Tulio Ribeiro, Sameer Singh, and Carlos Guestrin. "Why Should I Trust You?": Ex- plaining the Predictions of Any Classifier. In Proceedings of the 22nd ACM SIGKDD International Conference on Knowledge Discovery and Data Mining, KDD '16, page 1135-1144, New York, NY, USA, 2016. Association for Computing Machinery.
- [Selvaraju et al., 2017] Ramprasaath R. Selvaraju, Michael Cogswell, Abhishek Das, Ramakrishna Vedantam, Devi Parikh, and Dhruv Batra. Grad-cam: Visual explanations from deep networks via gradient-based localization. In 2017 IEEE International Conference on Computer Vision (ICCV), pages 618-626, 2017.
- [Sundararajan et al., 2017] Mukund Sundararajan, Ankur Taly, and Qiqi Yan. Axiomatic attribution for deep net- works. In Proceedings of the 34th International Con- ference on Machine Learning -Volume 70, ICML'17, pages 3319-3328, Sydney, NSW, Australia, August 2017. JMLR.org.
- [Vilone and Longo, 2021] Giulia Vilone and Luca Longo. Notions of explainability and evaluation approaches for explainable artificial intelligence. Information Fusion, 76:89-106, 2021.
- [Yang and Kim, 2019] Mengjiao Yang and Been Kim. Benchmarking Attribution Methods with Relative Feature Importance. https://arxiv.org/abs/1907.09701, 2019. Link
- [Yeh and Lien, 2009] I-Cheng Yeh and Che-hui Lien. The comparisons of data mining techniques for the predictive accuracy of probability of default of credit card clients. Expert systems with applications, 36(2):2473-2480, 2009.
- [Yeh et al., 2019] Chih-Kuan Yeh, Cheng-Yu Hsieh, Arun Suggala, David I Inouye, and Pradeep K Ravikumar. On the (In)fidelity and Sensitivity of Explanations. In Ad- vances in Neural Information Processing Systems, vol- ume 32.
- Curran Associates, Inc., 2019.
- [Zhou et al., 2021] Jianlong Zhou, Amir H. Gandomi, Fang Chen, and Andreas Holzinger. Evaluating the quality of machine learning explanations: A survey on methods and metrics. Electronics, 10(5), 2021.
References were extracted automatically from the PDF and may contain errors.
Full text extracted automatically from the PDF; figures, tables and equations may differ. The PDF is the version of record.
1 Introduction
Explainable AI (XAI) has grown into its own research area, mainly due to the emergence of deep learning, the DARPA research grant [DARPA, 2016], and the inclusion of a right to explanation in the European General Data Protection regulation [Hoofnagle et al., 2019]. Over the last years many methods and approaches to explain (mostly deep) learning models were proposed [Guidotti et al., 2018; Barredo Arrieta et al., 2020; Gilpin et al., 2018; Adadi and Berrada, 2018]. Some methods differ only slightly (e.g., GradCAM [Selvaraju et al., 2017], GradCAM++ [Chattopadhyay et al., 2019], or differ in their implementation with the same user-facing output (e.g., LIME [Ribeiro et al., 2016] and SHAP [Lundberg and Lee,
2017]). Research established that the quality of explanations has to be measured by multiple facets (see [Nauta et al., 2023] for a recent survey). Quality criteria are, e.g, how reliably the explanation represents the model's inner reasoning, how compact the explanation is (larger explanations are deemed harder to comprehend by end-users) and how well the explanation aligns with knowledge within the application domain. However, a practical question has not yet been answered: How to reliably compare different methods and benchmark them to track research progress in the community.
XAI toolsheets [Karunagaran et al., 2022] summarize the main features of an XAI toolkit (similar to model cards [Mitchell et al., 2019]), but without evaluation details. Early work [Doshi-Velez and Kim, 2018] broadly categorizes XAI evaluation in application-grounded (evaluating with domain experts in real applications), human-grounded (evaluating with lay persons on simplified tasks) and functionallygrounded (evaluating with computational proxy measures, without humans). Follow-up work extends and refines this categorization [Zhou et al., 2021; Mohseni et al., 2021; Vilone and Longo, 2021; Lopes et al., 2022; Nauta et al., 2023]. We adopt the categorization by [Nauta et al., 2023], who define 12 desirable criteria (Co-12) for functionallygrounded evaluation and present a comprehensive list of data types and explanation types. In contrast to previous XAI evaluation surveys, we focus on XAI evaluation toolkits from a practical perspective.
In this survey, we investigate which easy-to-use implementations for evaluating XAI methods are available, and identify gaps and future directions for research into reliable XAI evaluations. More precisely, we address the following questions:
- Which XAI evaluation toolkits are available, how easily can they be applied or extended to own methods or data? [Overview]
- Which datasets with ground-truth explanations are available and which benchmarks can be used? [Explanation evaluation data sets]
- Which specific XAI evaluation metrics are implemented in which toolkit and which aspects of explanation quality are covered? [Metrics and coverage]
- Do implementations of the same metric in different
toolkits produce the same evaluation results? [Crosstoolkit reproducibility]
We first discuss our strategy for collecting and annotating our the toolkits. We then discuss XAI evaluation toolkits, datasets and evaluation metrics separately, and present results from a cross-toolkit reproducibility experiment. We conclude by outlining open challenges for the XAI community.
2 Source Selection and Annotation
We performed a semi-systematic review of available toolkits. A distinction between toolkit or library is not relevant for the purpose of this paper and we refer to all software that goes beyond the pure implementation of a single metric as toolkit. We searched GitHub for XAI toolkits retrieving 48 repositories 1 . We excluded repositories that did not have an associated paper and had an insufficient README file. Additionally we performed a general web search for 'explainable AI evaluation library' and 'explainable ml toolkit'. We included results from the first two result pages, for which source code was available and which were not behind a paywall. We additionally searched the NeurIPS 2022 program as proceedings were not yet indexed by search engines. From the combined result list, we further excluded toolkits that do not contain at least one metric for evaluating XAI methods. All results were checked by two annotators. This strategy resulted in 17 toolkits in total. In the following, we describe how we annotated evaluation metrics, data types and usability in detail.
Evaluation metrics. For each toolkit we extracted the available evaluation metrics from the GitHub repository and, if applicable, the corresponding publication. We then doubleannotated each metric with the theoretical criteria developed in [Nauta et al., 2023]. Specifically, we annotated type of data (e.g., text, images, tabular), type of explanation (e.g., feature importance, localisation), and the Co-12 evaluation criteria (e.g., correctness, completeness, continuity). Disagreements between annotators were discussed - if needed with a third annotator - until a final decision was reached.
Data types. We found that a clear overview of supported modalities by a toolkit is often missing. To identify for which data types a toolkit is applicable (Table 1), we therefore analysed the toolkit's documentation, README, source code, used datasets and the publication about the toolkit. For collecting the data types per evaluation metric (Table 3), we analysed the toolkit's metric documentation and the publication that introduced the evaluation metric.
Usability. To estimate how easy it would be for XAI method developers to evaluate their method in each toolkit or extend the toolkit with evaluation methods, we further assessed all toolkits on three dimensions of usability: active maintenance, interaction with community and documentation, as shown in Table 1. Scores on each dimension can range from 0 to 5. Active maintenance is evaluated by checking whether: the toolkit has more than 3 commits on more than 3 different days (+2), the latest commit was less than
1 Search terms 'XAI evaluation', and 'explainable AI evaluation', on Dec 1st, 2022
6 months ago (+2) and there are versions released (+1). The community interaction is scored based on whether there was a clear possibility for externals to contribute to the project (+2 for contributing statements or +1 for having a leaderboard), and whether GitHub issues were answered (+2 if some are answered, +3 if all are answered, ignored when there were no issues). The documentation of the toolkit was scored by checking whether the README includes a reference to a publication or informative website (+1) and instructions on usage and installation (+1), whether code was documented (+1 for comments in code, +2 for formal documentation) and whether examples or tutorials were available (+1).
3 Toolkits
Out of 17 identified toolkits, 12 are pure evaluation toolkits, i.e., the focus of the toolkit is the evaluation of XAI methods, whereas 5 are XAI toolkits, i.e., not focusing on evaluation, but providing explanation methods and including some evaluation support. Table 1 provides a concise overview.
The majority of toolkits support images (11) and structured data (9), whereas graph and time series data are only supported by one toolkit each. User-item matrices commonly used in recommender systems as well as videos are not supported by any toolkit and thus omitted from the table.
We found a huge variance in the usability scores (maintenance - community interaction - documentation). Overall, XAI toolkits are more mature than the evaluation toolkits, with the exception of Ablation (5-4-5) and Quantus (5-4-5).
Ablation natively supports multiple major machine learning frameworks (Scikit-learn, PyTorch, Tensorflow and Keras). While metric implementations that do not require access to the predictive model (and/or explanation method) should require only little implementation overhead, such a built-in support still speeds up the evaluation process.
In turn, Quantus supports the largest variety of explanation types (feature importance, heatmaps, localisation, prototypes and decision trees/rules methods), whereas 13 toolkits only support either feature importance (5) or heatmap (1) or both (7). From the 13 types of explanations specified in [Nauta et al., 2023], only 5 are covered in any of the toolkits. Quantus also shows the highest coverage of the Co-12 criteria (6 out of 12), whereas 8 toolkits only support evaluation of 1 criterion with correctness being the most prominent (5).
4 Datasets &Benchmarks
Out of 17 toolkits, 5 include datasets with ground-truth explanations for XAI evaluation: ExPMRC, GraphXAI, BAM, XAI-Bench and OpenXAI (c.f. Table 2). Some of these datasets required additional annotation for creating the ground-truth explanation, e.g., evidence spans were annotated in the ExPMRC datasets, whereas XAI-Bench and OpenXAI created their own synthetic data with known ground-truth explanation. Most datasets were associated with graph classification task (5), followed by machine reading comprehension task (4), structured data classification (2), image classification (1) and regression (1). Further, 3 toolkits also provide the option of benchmarking the XAI evaluation methods on their dataset: ExPMRC and OpenXAI provide Table 1: Overview of toolkits. Year indicates publication year for toolkits with publications, first software release otherwise, release version or GitHub commit id in footnotes. Usability scores (in order): active maintenance, interaction with community, and documentation (3 scores denoted as X-X-X, each in range 0-5 from lowest to best). ML refers to supported machine learning frameworks: Scikit-learn (S), PyTorch (P), Tensorflow (T), Keras (K), PaddlePaddle (D). Data types (in order): Graph (G), Image (I), Tabular/Structured (S), Text (X), Time Series (T). Expl. Type shows for which type of explanation the toolkit is applicable: feature importance (FI), heatmap (HM), localisation (LC), prototypes (PT), decision trees and decision rules (DT). The Co-12 coverage indicates which criteria of the Co-12 XAI evaluation framework are covered by evaluation metrics in the toolkit. Criteria (in order): Correctness, Completeness, Consistency, Continuity, Contrastivity, Covariate complexity, Compactness, Composition, Confidence, Context, Coherence, Controllability.
| Toolkit | Usability | Stars | ML | Data Types | Expl. Type | Co-12 Coverage |
|---|---|---|---|---|---|---|
| XAI EVALUATION TOOLKITS | ||||||
| Ablation (2022) a | 5-4-5 | 8 | P | G I S X T | FI HM LC PT DT FI HM LC PT DT FI HM LC PT | |
| CompareXAI (2022) b | 4-2-3 | 7 | S | G I S X T | ||
| ExPMRC (2022) c | 0-1-4 | 57 | n.a. d | G I S X T | DT | |
| GraphXAI (2022) e | 4-2-4 | 57 | P | G I S X T | FI HM LC PT DT | |
| OpenXAI (2022) f | 4-3-4 | 121 | P | G I S X T | FI HM LC PT DT | |
| Quantus (2022) g | 5-4-5 | 271 | PT | G I S X T | FI HM LC PT DT | |
| Safari (2022) h | 2-0-2 | 2 | P | G I S X T | FI HM LC PT DT | |
| Eval XAI (2021) i | 4-0-1 | 5 | P | G I S X T | FI HM LC PT DT | |
| PhE-Eval (2021) j | 2-0-4 | 1 | ST | G I S X T | FI HM LC PT DT | |
| XAI-Bench(2021) k | 2-2-4 | 32 | S | G I S X T | FI HM LC PT DT | |
| XAI-Eval(2021) l | 0-0-1 | 2 | K | G I S X T | FI HM LC PT DT | |
| BAM (2019) m | 2-2-4 | 44 | T | G I S X T | FI HM LC PT DT | |
| XAI TOOLKITS | ||||||
| Doctor XAVler (2022) n | 0-0-0 | 0 | P | G I S X T | FI HM LC PT DT FI HM LC PT | |
| IntepretDL (2022) o | 5-5-5 | 160 | D | G I S X T | DT | |
| Shapash (2021) p | 5-5-5 | 2.1k | S | G I S X T | FI HM LC PT DT | |
| AIX 360 (2020) q | 5-4-5 | 1.2k | SPTK | G I S X T | FI HM LC PT DT | |
| Captum (2020) r | 5-5-5 | 3.6k | P | G I S X T | FI HM LC PT DT | |
a v0.1.0 [Hameed et al., 2022], https://github.com/capitalone/ablation
b 4f8bc24 [Belaid et al., 2022], https://github.com/Karim-53/Compare-xAI
c 9827fed [Cui et al., 2022], https://github.com/ymcui/expmrc
d model predictions are uploaded to benchmarking suite
e 2f0e94d [Agarwal et al., 2022b], https://github.com/mims-harvard/GraphXAI
f 83c2ef1 [Agarwal et al., 2022a], https://github.com/AI4LIFE-GROUP/OpenXAI
h 57be48f [Huang et al., 2022], https://github.com/havelhuang/Eval XAI Robustness
i e0b205a [Lin et al., 2021], https://github.com/yslin013/evalxai
k f0431a7 [Liu et al., 2021], https://github.com/abacusai/xai-bench
l c6ca07f [Graziani et al., 2021], https://github.com/maragraziani/XAI evaluation
m 0644a9e [Yang and Kim, 2019], https://github.com/google-research-datasets/bam
n 114e943 [Ngai and Rudzicz, 2022], https://github.com/hillary-ngai/doctor XAvIer
o v2.4.1 [Li et al., 2022], https://github.com/PaddlePaddle/InterpretDL
p v2.2.0 https://github.com/MAIF/shapash
q v0.2.1 [Arya et al., 2020], https://github.com/Trusted-AI/AIX360
r v0.5.0 [Kokhlikyan et al., 2020], https://github.com/pytorch/captum
| Toolkit | Dataset | Description | Task | Size | B |
|---|---|---|---|---|---|
| ExPMRC | Squad CMRC Race+ C3 | Span extraction fromWikipedia (English) Span-extraction (Chinese) Multiple-choice exams (English) Multiple-choice exams (Chinese) | MRC MRC MRC MRC | 1003 (Q), 632 (P) 1015 (Q), 768 (P) 1125 (Q), 335 (P) 1005 (Q), 517 (P) | |
| GraphXAI | MUTAG Benzene Fluoride-carbonyl Alkanyl-carbonyl SG-X | Nitroaromatic compounds, mutagenicity prediction Molecules, with our without benzene ring Molecules, with or without fluoride and carbonyl Molecules, with or without alkane and carbonyl 4 datasets of synthetic graphs with varying properties | GC GC GC GC NC | 1768 (G) 12000 (G) 8671 (G) 4326 (G) >13000 (N) | |
| BAM | Obj, Scene, Scene only | 3 datasets combining MSCOCO and MiniPlaces, labels are objects or scene labels | C | 100 k (I) | |
| XAI-Bench | Synthetic | (Mixtures) of probability distributions | R/C | n.a. (S) | |
| OpenXAI | Synthetic | 20 continuous features from Gaussian distribution | C | 5000 (S) |
a website, where developers can submit their scores to be included in the leaderboard, and XAI-Bench provides command line support to benchmark 6 feature attribution methods on synthetic datasets. Note, that XAI methods are also evaluated on datasets without explanation ground-truth, e.g. using the single deletion evaluation method [Nauta et al., 2023]. We omitted those datasets from the table. Specifically, GraphXAI and OpenXAI include the German credit card [Dua and Graff, 2017], recidivism, credit defaulter [Agarwal et al., 2021], give me some credit [Freshcorn, 2022], HELOC [Holter et al., 2018] and adult income datasets [Yeh and Lien, 2009].
5 EvaluationMetrics
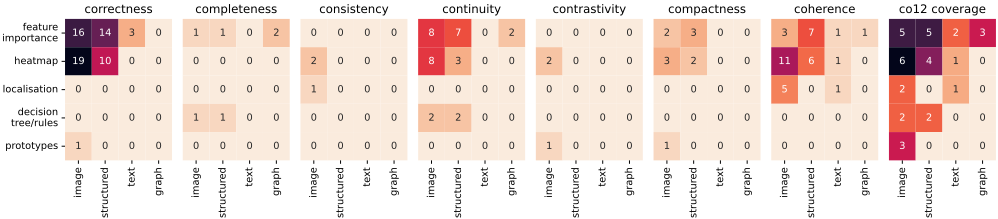
The overview in Table 1 is an aggregated view of supported explanation/data types and Co-12 coverage per toolkit. In this section, we provide details on the Co-12 coverage per explanation/data type combination (Figure 1, Section 5.1) and from the perspective of evaluation metrics (Figure 3, Section 5.2). In total, we annotated 86 evaluation metrics implemented in 17 toolkits. Each implementation of a metric in a toolkit is annotated with the corresponding Co-12 criteria, supported explanation and data types and similar metrics are grouped together according to the categorization by [Nauta et al., 2023].
5.1 Co-12 Coverage
Figure 1 shows a strong imbalance in how well individual Co12 criteria are covered, as well as in the coverage of explanation and data types per Co-12 criterion. Faithfulness of the explanation to the model (Correctness), stability to slight variations (Continuity) and plausibility for end users (Coherence) are covered by multiple metrics in multiple toolkits. Only a few metrics are readily available in toolkits for how much of the predictive model's behavior is covered by the explanation (Completeness), how informative the explanation is w.r.t. alternative events (Contrastivity) and how compact the explanation is (Compactness - smaller explanations are deemed easier to comprehend). Five of the twelve Co-12 criteria are not covered by any metric in any toolkit at all and hence omitted in the figure. These comprise: complexity of feature interactions in the explanation (Covariate complexity), format and structure (Compositionality), probabilistic information (Confidence), relevance to users' needs (Context) and extent of user interaction or control (Controllability). Further, there is a strong focus on the explanation types feature importance and heatmap and image and structured/tabular data (top left corner of the last heatmap in Figure 1). Conceptually, heatmaps are 2-dimensional feature importance scores and localisation explanations correspond to binary feature importance, emphasizing the focus on feature importance even more. On average, five out of twelve Co-12 criteria are covered for feature importance/heatmap explanations and image/structured date, whereas only Coherence (1/12) is covered for localisation explanations on textual data.
5.2 Metrics in Detail
Table 3 can serve as a guide for XAI researchers, looking for means to evaluate a newly proposed XAI method. Towards this goal, the first column indicates the explanation type, followed by Co-12 coverage (2nd column), evaluation method groups (3rd column) and available toolkit implementations in the last column, indicating corresponding metric names and applicable data types (in boldface black squared boxes). Unfortunately, toolkit documentation rarely indicates the supported explanation and data types individually for each metric. Hence, there are data types that are supported by a particular metric (according to the original publication introducing that metric), but for which the toolkit implementing this metric does not claim native support. These may be supported with minor or no modifications (gray squared boxes). Similarly, we omitted time-series in Figure 1 and Table 3 as they are not explicitly supported by any metric.
| Co-12 | Evaluation Method Group [Nauta et al., 2023] | Toolkits with toolkit's evaluation metric |
|---|---|---|
| Correctness | White Box Check Controlled Synthetic Data | PhE-Eval I S X Ground truth Alignment XAI-Bench I S GT-Shapley, Eval XAI I IoU, RR, RD, OpenXAI S FA, RA, SA, SRA, RC, PRA, CompareXAI I X Stability, Stress test, I Simplicity, S Fidelity, Fragility |
| Importance | Single Deletion Incremental | Quantus I Monotonicity, SensitivityN, Quantus/AIX 360 I S / XAI-Bench I S Faithfulness, OpenXAI I S PGI, PGU Quantus I S Faithfulness I Monotonicity, ROAD, |
| Completeness Feature | Deletion/Addition Preservation Check | correlation, Selectivity, AIX 360/XAI-Bench I Monotonicity, Ablation S Feature perturbation, Doctor XAVler X FAD curve, InterpretDL I DeletionInsertion |
| GraphXAI G GEF, GEGF | ||
| Continuity | Fidelity for Variations Stability for Variations Fidelity for Variations | Quantus I S X Sufficiency Quantus I S Local Lipschitz estimate, I Max-Sensitivity, Avg-Sensitivity, Continuity, Input Invariance, Captum I Sensitivity, OpenXAI S RIS, RRS, ROS, GraphXAI G GES, GECF, Shapash S Stability Quantus I S X Sufficiency, Consistency, I Infidelity, |
| Compactness Coherence | Size Alignment Domain Knowledge XAI Methods Agreement | Captum/XAI-Bench/InterpretDL I Infidelity Quantus I S X Effective Complexity, I S Complexity, Shapash S Compacity Quantus I AUC, Non-Sensitivity, GraphXAI G GEA, CompareXAI I X Stress test OpenXAI S FA, RA, SA, SRA, RC, PRA, Shapash S Consistency |
| Correctness | Model Parameter Random. White Box Check Controlled Synthetic Data Single Deletion | Quantus I Model parameter randomisation PhE-Eval I S X Ground truth Alignment OpenXAI S FA, RA, SA, SRA, RC, PRA, Eval XAI I IoU, RR, RD, BAM I Model contrast scores, Input dependence rate Quantus I Pixel Flipping, SensitivityN, Quantus/AIX 360 I S /XAI-Bench I S Faithfulness, OpenXAI I S PGI, PGU |
| Consistency Continuity Heatmap | Incremental Deletion/Addition Implementation Invariance Stability for Variations | Quantus I Region Perturbation, Selectivity, IROF, ROAD, AIX 360 I Monotonicity, XAI-Bench I Monotonicity, ROAR, InterpretDL I MoRF, LeRF, DeletionInsertion XAI-Eval I Consistency, Repeatability Explanations Quantus I Max-Sensitivity, Avg-Sensitivity, Continuity, Input Invariance, Captum I Sensitivity, OpenXAI S RIS, RRS, ROS, BAM I Input independence rate, Safari I Worst-case interpretation discrepancy, |
| Contrastivity Compactness Coherence | Fidelity for Variations Target Sensitivity Size Alignment Domain Knowledge | Probabilistic interpretation discrepancy Quantus/Captum/XAI-Bench/InterpretDL I Infidelity Quantus I Random logit test, BAM I Model contrast scores Quantus I S X Effective Complexity, I S Complexity, I Sparseness Quantus I Pointing game, Attribution Localisation, Top-K Intersection, Relevance rank accuracy, Relevance mass accuracy, AUC, Focus, Non-Sensitivity, InterpretDL I X Pointing game segmentation, I Pointing game, XAI-Eval I Alignment with Clinical factors |
| Consistency LC Coherence | XAI Methods Agreement Implementation Invariance Alignment Domain Knowledge | OpenXAI S FA, RA, SA, SRA, RC, PRA, XAI-Eval I SSIM XAI-Eval I Consistency Quantus I AUC, Focus, Pointing game, Attribution Localisation, Top-K Intersection, ExPMRC X Correctness |
| Completeness DT Continuity | Fidelity for Variations Fidelity for Variations | Quantus I S X Sufficiency Quantus I S X Sufficiency, Consistency |
| Correctness Contrastivity PT Compactness | Controlled Synthetic Data Target Sensitivity Size | BAM I Model contrast scores BAM I Model contrast scores Quantus I Effective Complexity |
Looking at explanation type coverage from the perspective of metrics, we observe the same pattern as in Section 5.1: a strong focus on feature importance and heatmaps. In detail, heatmaps are supported by 52 metrics (out of 86), feature importance by 51, localisation by 7, and prototypes and decision trees/rules by 2 each. This enumeration is without duplicates, i.e., metrics implemented in multiple toolkits are counted only once. In particular, well-known metrics are implemented in multiple toolkits. For instance, Faithfulness estimate is implemented in 3 toolkits (Quantus, AIX 360 and XAI-Bench), for both, feature importance and heatmap explanations. Quantus and AIX 360 explicitly support image and structured data for this metric, whereas XAI-Bench only supports images explicitly. We also observed that the names of the metrics in toolkits are not necessarily the same as in the original paper. For instance, Avg-Sensitivity in Quantus and Sensitivity in Captum implement the same metric.
In summary, we observe a strong focus on feature importance explanations (even more when considering heatmaps and localisation as special case of feature importance), on image and structured data and on the 3 criteria Correctness, Continuity and Coherence. This focus is further amplified by the implementation of the same metrics in multiple toolkits.
6 Reproducibility
The same metric may be implemented differently across various toolkits. This raises the question of whether variations in implementation result in differing outcomes. In this section, we therefore conduct an experimental comparison of the evaluation results from different toolkits for the same metric. We analyze results for Infidelity [Yeh et al., 2019], the evaluation metric with the highest number (4) of implementations.
Infidelity [Yeh et al., 2019] measures the expected difference between a perturbed explanation and the change in the predictive model's output when the same perturbation is applied to the input. In detail, it is the expected difference between the dot product of the input perturbation, and the change in function values resulting from the input perturbation. Given a black-box function f , explanation functional Φ, and a random variable I ∈ Rd with probability measure µI, which represents meaningful perturbations of interest, the explanation infidelity of Φ is defined as:
IntegratedGradients GradientShap Saliency

We classify a single instance from the MNIST dataset using the predictive model presented in the original paper [Yeh et al., 2019]. On the prediction of this instance, we employ three different explainable AI methods, Integrated Gradients [Sundararajan et al., 2017], GradientShap [Lundberg and Lee, 2017], and Saliency [Baehrens et al., 2010], as implemented in Quantus [Hedstr¨om et al., 2022], to generate explanations. We then calculate Infidelity in the original implementation 2 and three out of four toolkits - Quantus [Hedstr¨om et al., 2022], Captum [Kokhlikyan et al., 2020], InterpretDL [Li et al., 2022], which support image and explanation inputs in the form of arrays or tensors, and output an infidelity score. We exclude the remaining toolkit - XAIBench [Liu et al., 2021] as it requires an unspecified input data format and would require significant adaptations to perform the metric calculation. In both, toolkits and original implementation, we use the default settings.
Figure 2 shows the original image and the generated explanations. Saliency, which is an older method, returns noisy explanations, while the more recent methods, Integrated Gradients and GradientShap, produce concise explanations. Table 4 shows the Infidelity calculated by three different toolkits and results from the original implementation. There is a significant discrepancy in the resulting values across toolkits, which can be attributed to the different default perturbation functions used. However, there is a relatively strong correlation among the toolkits. Specifically, high infidelity for noisy explanations (Saliency) and low infidelity for concise explanations (Integrated Gradients and GradientShap) align with the results of the original paper. It is worth noting that there is consistency in the ranking of the methods (Integrated Gradients < GradientShap < Saliency), but not in the distances between the methods. For example, in Captum, the difference between GradientShap and Saliency is smaller than the difference between Integrated Gradients and GradientShap, while the opposite is observed in InterpretDL.
2 https://github.com/chihkuanyeh/saliency evaluation
| Toolkit | XAI method | ||
|---|---|---|---|
| IG | GradientShap | Saliency | |
| Original | 1.21 | 1.56 | 10.02 |
| Quantus | 24780 | 25635 | 5356752 |
| Captum | 5735 | 7098 | 7423 |
| InterpretDL | 2.36 | 3.19 | 13.81 |
The results of our comparison on the same metric implemented in multiple toolkits suggest that the specific implementations have a significant impact on the resulting values. Therefore, it is not recommended to directly compare the values obtained from different toolkits. However, comparisons within a toolkit are still valuable.
7 Discussion
Choice of Toolkits. For standard explanation tasks, such as feature importance or heatmaps on images, there are multiple toolkits available. For the majority of XAI method developers, Quantus seems the most obvious choice, as it is a mature, well-documented and comprehensive (in terms of explanation types and Co-12 coverage) tool for evaluating XAI methods, with native support of PyTorch and TensorFlow models, and high usability scores. It is the only toolkit that supports time series data, but misses support for textual data, which is promised by the developers as next on their agenda. For evaluating methods on graph data, GraphXAI is the only toolkit available.
Toolkit-Metric Information Alignment. Matching data types claimed to be supported by the toolkit with the paper introducing the evaluation metric implemented in the toolkit was not straight forward. We have added both the information claimed by the toolkits and the information reported by the original paper introducing the metric.
Extending Co-12 Coverage. Toolkits only support evaluation metrics corresponding to at most 6 Co-12 criteria. We see opportunities to extend toolkits with more evaluation metrics that cover other Co-12 criteria. The collection of evaluation methods by [Nauta et al., 2023] may be a good starting point, though some criteria such as Controllability, Confidence and Context may not be easily benchmarked automatically and are better suited for evaluation with user studies.
Reproducibility and Comparisons. Some evaluation metrics are implemented in different toolkits, but with slightly different hyperparameters and implementations. As a result, values can not be directly compared across different XAI tools, but only within a toolkit. Thus, care has to be taken when comparing results reported in publications - without knowledge of the toolkit, and the parameters for the evaluation functions such comparisons are meaningless.
Benchmarks & Datasets. We found only a handful of toolkits that include any additional XAI evaluation dataset and even fewer promote benchmarking. As a recommendation, we call for inclusion of benchmarking in evaluation toolkits, as it could foster standardization while advancing the field of evaluating XAI. The limited availability of datasets in the analysed toolkits shows that XAI evaluation toolkits mainly focus on including evaluation metrics, without accompanying datasets for evaluation. We acknowledge that the identification of standalone datasets developed for the purpose of XAI evaluation was not the aim of this survey and could be an interesting direction for future work.
8 Conclusion
Our semi-structured review of XAI evaluation toolkits reveals that currently only a few aspects of explanation quality are covered and that results of the same metric may differ across toolkits, due to varying implementations. This work can serve as a guide for the XAI community for identifying evaluation methods that cover explanation quality more broadly and facilitating future implementations of evaluation metrics. We also aim that our work contributes to a standardization of XAI evaluation, that includes standard datasets and benchmarks for advancing development of XAI methods. Specifically, our call for action is as follows:
Researchers evaluating their XAI methods should use multiple metrics in order to cover explanation quality more broadly. When using an XAI evaluation toolkit, we recommend to take care of providing sufficient details for reproducibility. In addition to reporting the metric name, also the toolkit version and used hyperparameters should be provided in order to enable a transparent evaluation. Table 3 can serve as a useful starting point to find toolkit that support a particular type of explanation and data.
Researchers targeting evaluation of XAI are encouraged to think more broadly on explanation quality to cover other aspects when developing new evaluation metrics. Additionally, we recommend to investigate how existing evaluation metrics can be adapted to other data and explanation types.
Researchers developing metrics and creating datasets with ground-truths for evaluating XAI should consider to contribute them to an existing XAI toolkit.
Toolkit developers and maintainers could investigate the evaluation gaps we identified and consider adding support for more modalities, explanation types and evaluation metrics in the future. Furthermore, they are encouraged to improve usability by extending their documentation and report for each metric which data and explanation types are supported, what input data format is required, and what the recommended hyperparameters are based on the original metric publication. Cross-evaluation between evaluation toolkits (and with the original metric implementation) is encouraged in order to identify and rectify inconsistencies.
Acknowledgments
This work was partially supported by DFG RTG 2535.
@inproceedings{ijcai2023p747,
  title     = {Benchmarking eXplainable AI - A Survey on Available Toolkits and Open Challenges},
  author    = {Le, Phuong Quynh and Nauta, Meike and Nguyen, Van Bach and Pathak, Shreyasi and Schlötterer, Jörg and Seifert, Christin},
  booktitle = {Proceedings of the Thirty-Second International Joint Conference on
               Artificial Intelligence, {IJCAI-23}},
  publisher = {International Joint Conferences on Artificial Intelligence Organization},
  editor    = {Edith Elkind},
  pages     = {6665--6673},
  year      = {2023},
  month     = {8},
  note      = {Survey Track},
  doi       = {10.24963/ijcai.2023/747},
  url       = {https://doi.org/10.24963/ijcai.2023/747},
}
TY - CPAPER TI - Benchmarking eXplainable AI - A Survey on Available Toolkits and Open Challenges AU - Le, Phuong Quynh AU - Nauta, Meike AU - Nguyen, Van Bach AU - Pathak, Shreyasi AU - Schlötterer, Jörg AU - Seifert, Christin T2 - Proceedings of the Thirty-Second International Joint Conference on Artificial Intelligence, IJCAI-23 PB - International Joint Conferences on Artificial Intelligence Organization PY - 2023 SP - 6665 EP - 6673 DO - 10.24963/ijcai.2023/747 UR - https://doi.org/10.24963/ijcai.2023/747 ER -Copied
Machine-readable versions of this paper, for tools and AI agents:





